Hardware Archeology: HP 48GX

May 24th, 2020

Back in college, programmable calculators were starting to become a thing and by the time I hit grad school, the HP 48GX came out. It was the closest thing to a handheld computer that I’d ever had.

For the time, it was truly impressive. It could do all the standard calculator functions but it could also run simple programs and I wrote a few.

One in particular that I was pretty proud of was an implementation of a card game called Set. It’s based on trying to find sets of 3 cards that are all the same or all different in 4 categories: number, color, shape, and pattern. But the HP 48GX, as advanced as it was, was only black and white and had very low resolution (131×64 pixels). So I simplified the shapes and instead of colors, I re-used the pattern in the background of the shapes.

It worked out pretty well. The funny thing was that the processor on the calculator was so slow that I couldn’t check all the possible combinations very quickly. Instead it just checked for one combination per loop and it was possible for a human player to actually find a set before the calculator.

I managed to dig up my old calculator and was amazed to find it still worked when I put in some fresh batteries. Unfortunately, the memory was wiped but I found an archive of my old HP 48GX work and still have the original program and readme.txt file.

Reddit Tracking

May 22nd, 2020

I occasionally post on Reddit and the other day, I posted that admitting you’re wrong is a sign of growth, not weakness and it got pretty popular. Then it got deleted because apparently, the mods thought it was common sense. I disagree, but it’s their group so fair enough.

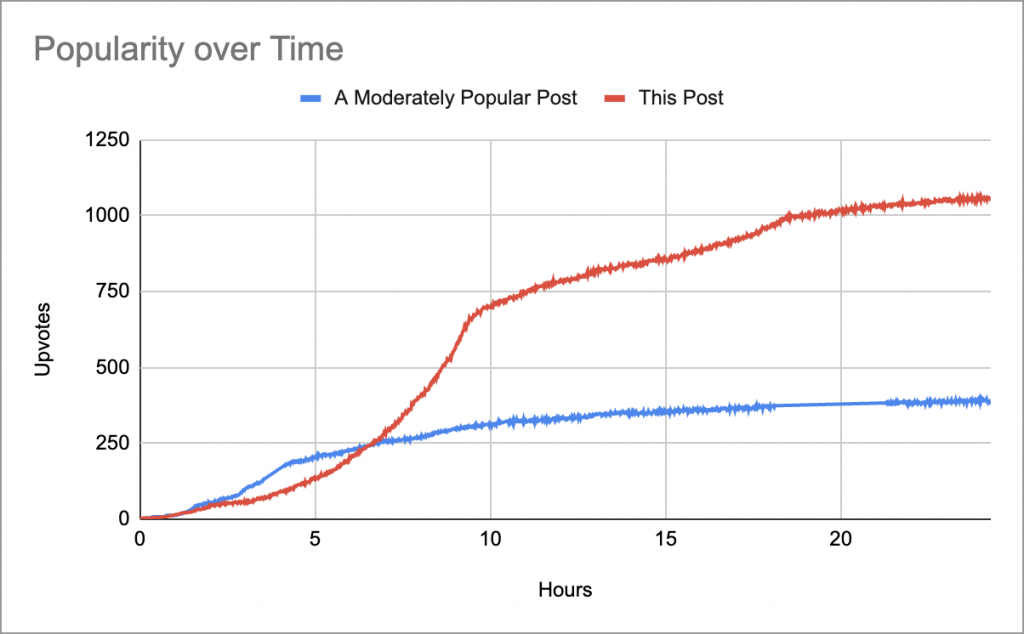
So then I thought it would have been interesting to see how the post’s popularity changed over time. But I don’t think Reddit keeps track of that kind of information. So I wrote a super hacky script to do just that. Then I ran it whenever I made another post and eventually made a post (about the difference between addictive and fun) that was moderately popular. I tracked it over 24 hours (with some breaks because the script crashed a few times; like I said, it’s super hacky) and that’s the blue graph.

So then I thought it would be kinda neat to post a graph to Reddit that tracked the popularity of the post itself! Unfortunately, images can’t be changed once posted. But if you post a link to an article with the image, Reddit extracts the image. So if you update an image in an article, would the image update on the Reddit post? I don’t know. But that’s what this blog post is attempting to find out.

Which States are Recovering?

May 7th, 2020

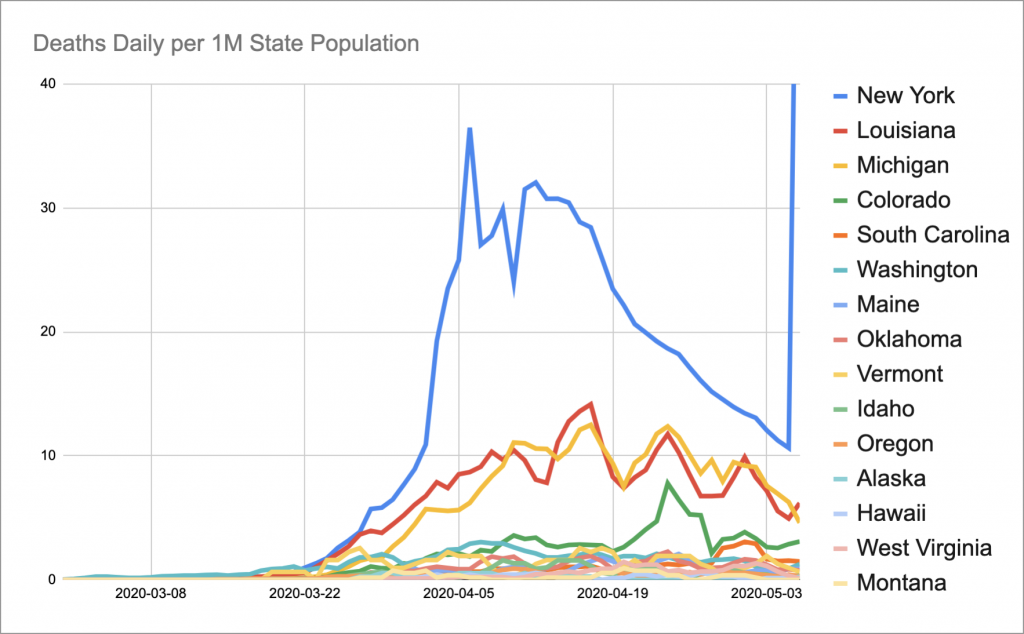
I’ve been looking at the COVID-19 dataset from the New York Times GitHub repository trying to get a sense of how states are doing and which ones are recovering. I wrote a little script to collate the data, put it all into a spreadsheet, and came up with this graph:

These are the states whose daily death counts have dropped to half of their maximum. (The spike at the end for New York is due to a large number of nursing home deaths that were finally added to the data, so hopefully it’s just a one-time correction.)

Most of the ones that are doing the best are very low population states except Hawaii and West Virginia. Hawaii is a special case because they’re an island and people flying in are quarantined for 14 days. This drastically cuts down on their tourist population so their beaches are naturally pretty empty compared to normal. As for the rest, they seemed to take their lockdown pretty seriously. So, long story short, the best strategies for fighting COVID-19 seem to be:

  • Have low population density.
  • Be an island and institute a 14-day quarantine.
  • Take lockdown seriously.

Innocuous Pong

April 26th, 2020

Last year, I participated in a weekend game jam with some friends to make Pigsy Banksy, a simple little platformer where you play a flying piggy bank. This year, I decided to try the solo version and made a game on my own in 48 hours. Details are on the Ludum Dare page. You can download it for Windows or Mac and even play it on the web.

The theme was “Keep it Alive” and I was doodling some ideas around something like paddle ball. Dyson looked at it and said, “How about Pong?”. So I considered that for a bit and thought it might be kinda cool to make a simple one-player version of Pong that steadily got more and more complex.

It’s a very simple concept but I’m pretty happy with what I did for the ultimate level when the player gets a score of 15. The other thing I’m pretty happy about is that I managed to come up with all the sound in the last couple hours.

If you can, try out the game and see if you can get to a score of 15. Otherwise, feel free to check out the full game demo video below:

Two Weeks Later

April 12th, 2020

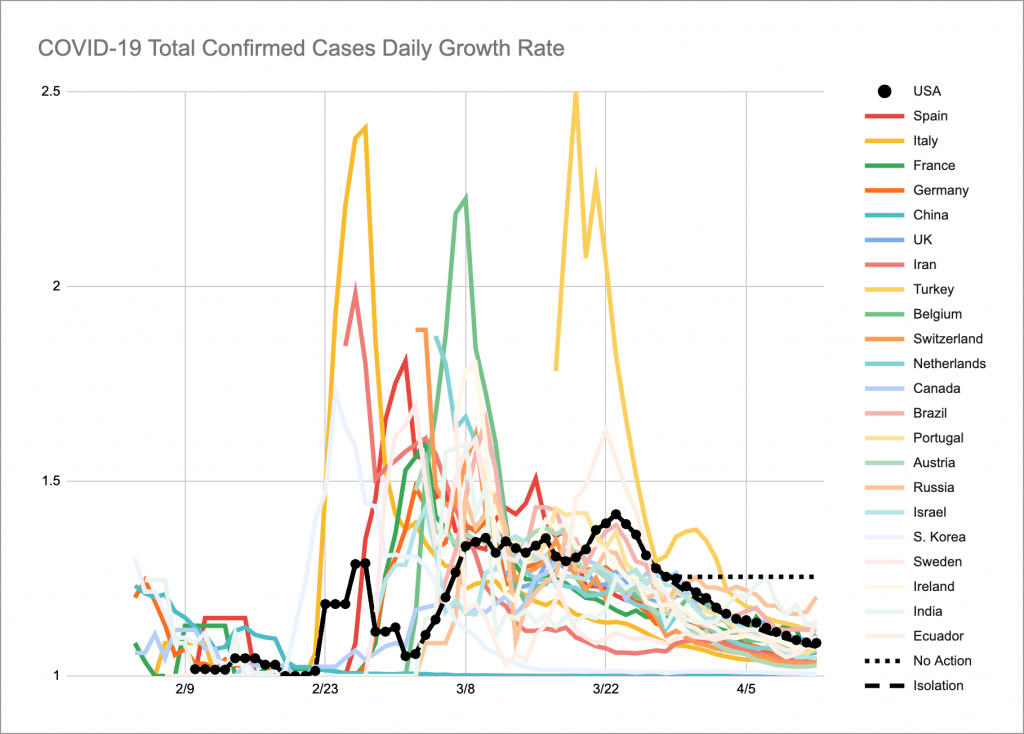
A couple weeks ago, I tried to make some predictions on how things might go depending on whether we continued isolating or not. How did it go? Well, for the most part, the U.S. has adhered to isolating and it really showed when looking at the graph of growth rate (the dots almost completely overlap the “No Action” prediction):

The two weeks went almost exactly how I imagined, which was:

Gn = (Gn-1 – 1)/(Gn-2 – 1) * (Gn-1 – 1) + 1

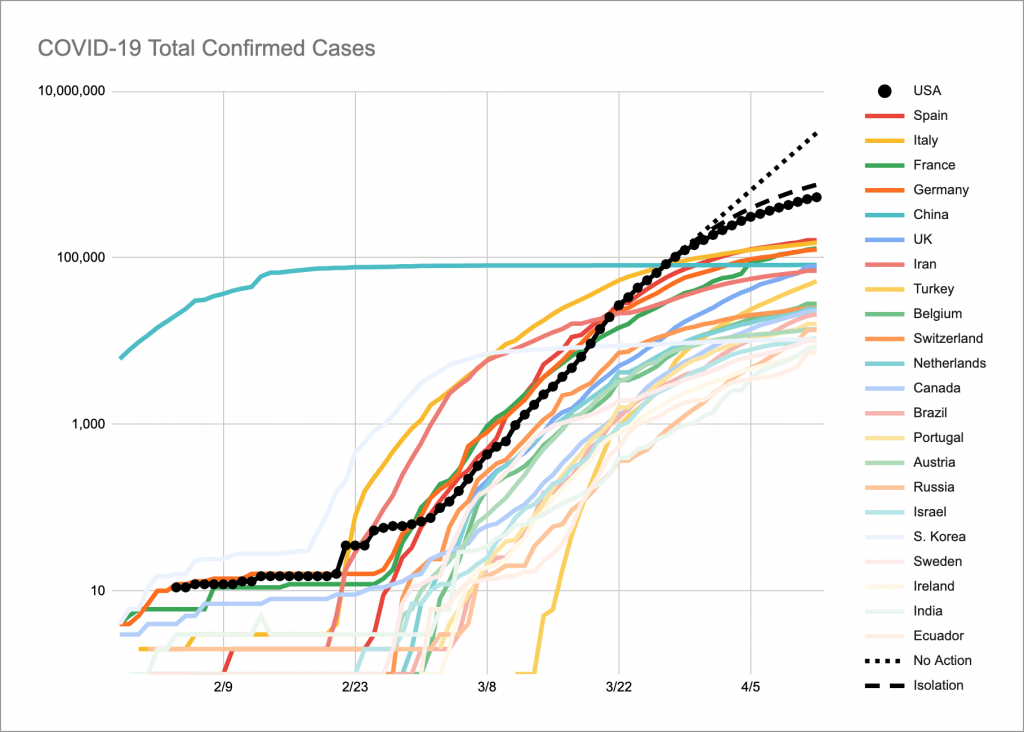
Or in other words, a function that geometrically decayed towards 1. That’s great news as it means that if we continue holding out, we’re over the inflection point. Similarly, the total number of cases was pretty close as well:

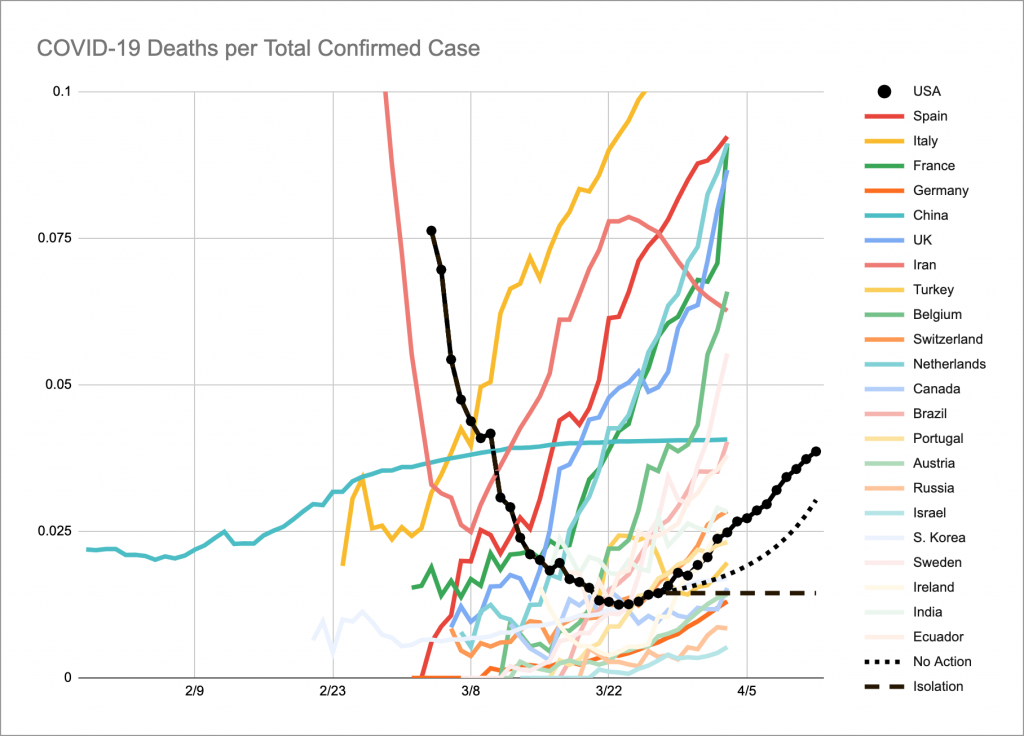
Unfortunately, my prediction for “lethality” didn’t turn out as well as I had hoped:

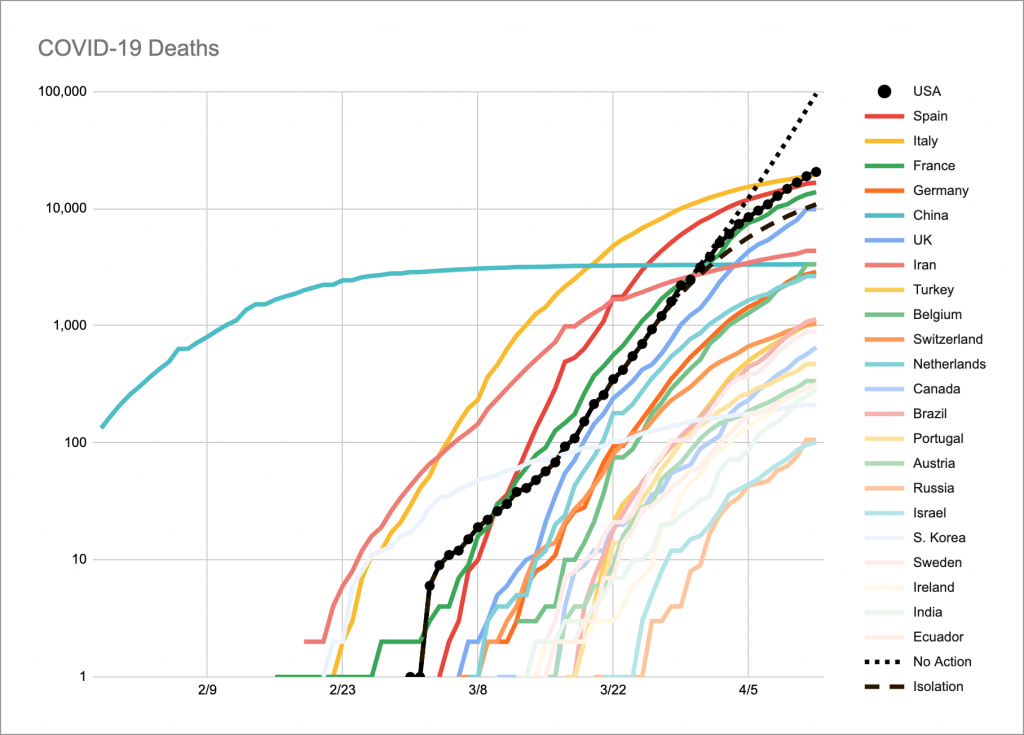
In hindsight, this makes sense. Even if we were perfectly isolated, it would have taken a few days for that to reflect in the numbers for people who already had it. We can see that better in the graph for total number of deaths:

The graph is starting to taper, but it took a few more days for it to taper than I had initially hoped. Still, it’s been getting better. So I think we’ve avoided the worst of it. The bigger question is how long can we hold out? What will the world look like when this is over?

COVID-19 Over the Next Two Weeks

March 27th, 2020

I am not an epidemiologist. That’s very important to keep in mind.

But I do have a little experience with data analysis and spreadsheets so I’ve been tracking the COVID-19 data from worldometers.info in this spreadsheet, trying to make sense of it. Specifically, I’ve been trying to figure out what might happen over the next couple of weeks, say, by Easter.

Bottom line: what we do next could be the difference between 10,000 and 100,000 deaths.

First, I started by modeling the “growth rate” of the total confirmed positive cases. This isn’t a great number because we know we’re not testing everyone, so the actual number is probably significantly higher. But looking at all the countries, there’s a noticeable pattern:

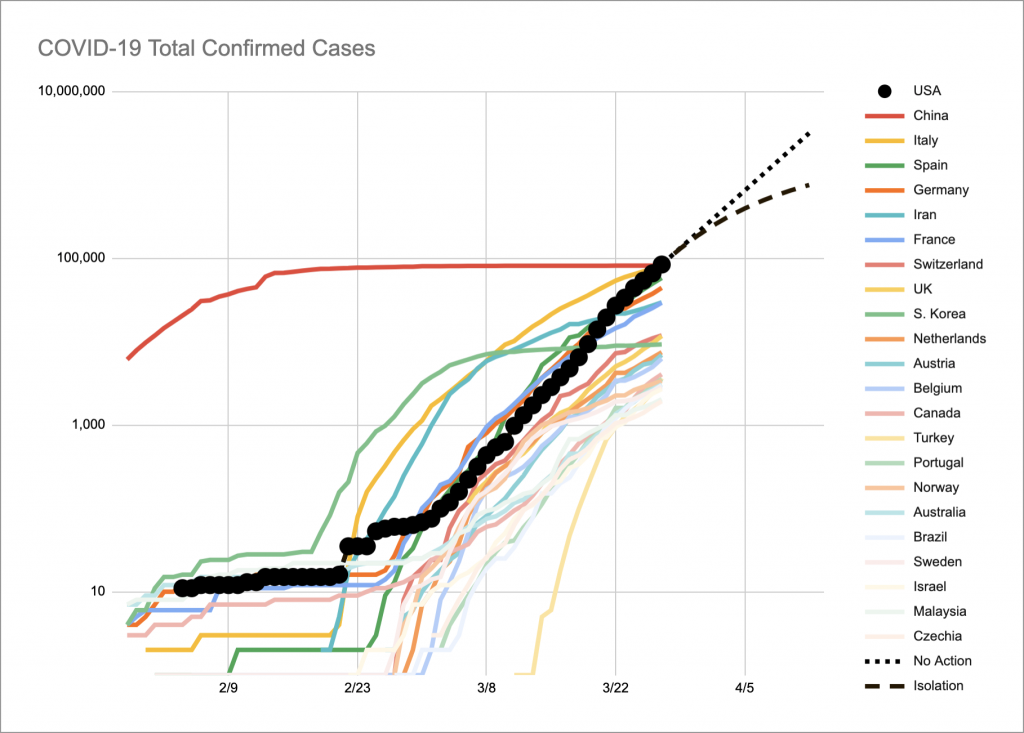
Every country went through a spike as it saw outbreaks and then a gradual tapering down as they started to take action. The U.S. started taking aggressive action a week or two ago (depending on the state) and so it’s possible that we’re starting to see a slowdown of the growth. The two dotted lines represent my guess over the next two weeks depending on whether we stop isolation or if we continue isolating. So from there, we can extrapolate numbers for the total confirmed cases:

Depending on what we do, this could be the difference between 750,000 and 3,000,000 total confirmed cases. From there, I tried to estimate the number of total deaths that would be by trying to guess what the “lethality” is (the number of deaths per confirmed case). Again, it’s not a great number because there are so many factors going on. But looking at the graphs for all the countries, there seems to be a reasonable pattern:

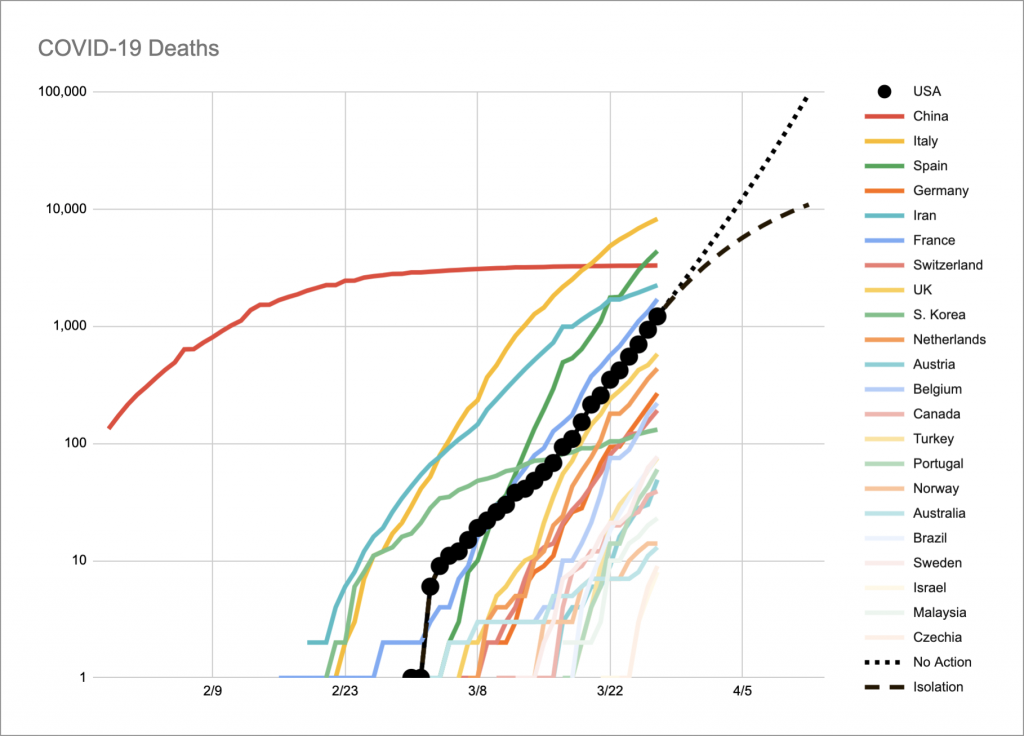
The countries that have taken aggressive action seem to level off at some ratio, which is probably proportional to how much testing they do. But some countries start seeing so many cases that their medical infrastructure starts to get overrun and then they start seeing more deaths per case. I took a guess at what that might look like in the U.S. From there, we can use that to extrapolate how many people might die in total:

And what you see there is the difference between 10,000 and 100,000 people dying from this. The scary thing about the “No Action” scenario is that it’s exponential growth, which means that it’d hit 1,000,000 deaths a week later. This is why we need to take this seriously. Yes, the cost is huge and not just economic. But if we do the right thing, we can get through this.

In related news, I’m glad to see that Japan postponed the Tokyo Olympics. I’ve never been so happy to have a video made obsolete.

Humor During a Pandemic

March 15th, 2020
https://youtu.be/Zuwsh58tDSE

It’s been a crazy week. The COVID-19 coronavirus has been in the news for months, but it wasn’t all encompassing. At work on Monday, we launched another release of our team’s product. On Tuesday, we were pretty busy discussing what we were doing next when we got an email saying that it was recommended that we all start working from home on Wednesday and … that was it. We spent rest of the day preparing to work from home and that was the last time I will see everyone for a month or so. By Friday, my kid’s school announced closures. Kinda surreal. It’s surprising to see how fast things can change.

It’s been interesting to see what’s changed and what hasn’t. Shopping has been intense. Fortunately, there hasn’t been much hoarding in my area, but the grocery store was the busiest I’d ever seen. The climbing gym that I usually go to was pretty quiet, but not extraordinarily so.

But one thing that surprisingly hasn’t changed (as of the time of this writing) is the 2020 Tokyo Olympics, in about five months. So, since I make videos about the Japanese language, I made a video about this as well. I’m hoping that I’m wrong, but it doesn’t seem like it’s prudent to continue with a large-scale event like that so close to a pandemic. Who knows? Maybe it’ll all be over in a few months.

On a related note, I actually made two versions of this video. The first one didn’t seem quite right so I redid the whole thing to what you see above. But if you’re curious, here’s the Pi Day version of the video and you can learn a bit more about “my process”.

Blacksmithing

March 10th, 2020

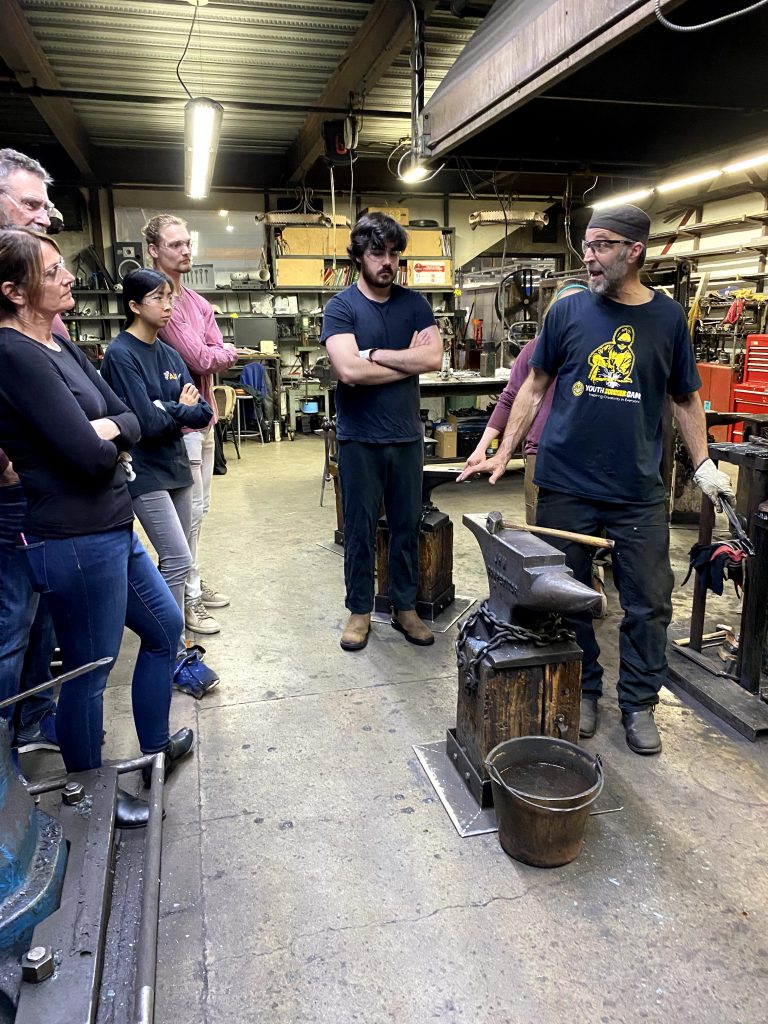
For Christmas, my wife got me a weekend workshop course of blacksmithing at the crucible! I was a great couple of days and by the end of it, I made a hook, a knife, a spoon, and a fork. I also had made a little snail on another day that I had access to a forge, which I heat treated with oil during the workshop.

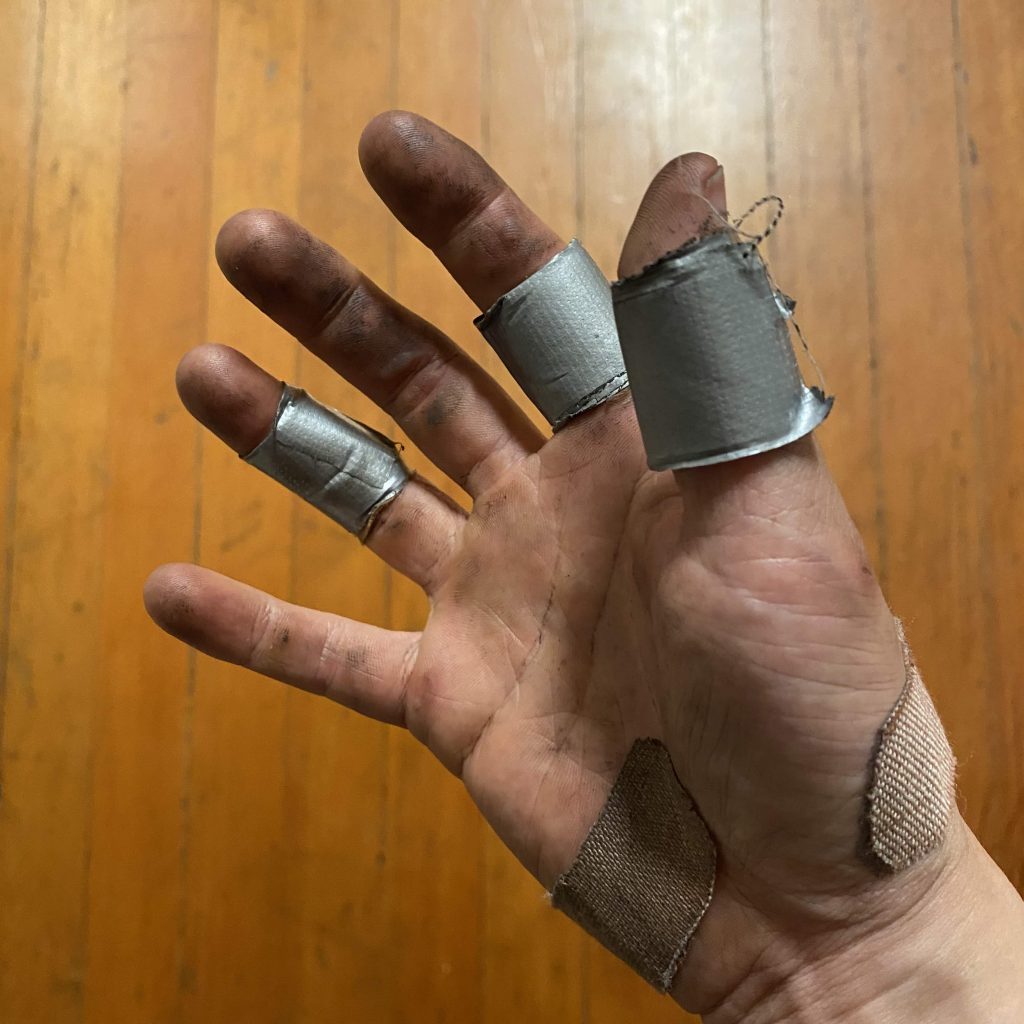
It was a lot of fun, but whoa was it hard on the hands. By the end of it, I had a lot of blisters. See, the hammer isn’t super heavy but you hold it kinda loosely and let gravity do the work. But then the hammer grip rubs back and forth, which led the the aforementioned blisters. But it was all worth it because now I have my very own set of cutlery.

Inktober 2019

November 7th, 2019

I did Inktober again this year! It’s all on my Instagram account but I like keeping an archive here as well.

I used brush pens again and it’s been a struggle to get decent color. On a couple of them, I switched to watercolor and that seemed to work a little better. I think if I do it again, I might switch to a more traditional pen or a thinner brush as it’s been really hard for me to draw a decent thin line with what I’ve got.

Inktober is fun to do, but whooo, it sure does take a lot of time. I kinda stopped with most of my other projects while I was doing it. I’d like to spend more time drawing but I need to figure out how to incorporate it into the rest of my life.

New Vlogging Equipment

October 31st, 2019
https://www.youtube.com/watch?v=QslUvgBS1m4

You might have noticed that the production qualities on my videos are … not the greatest. I just use the webcam on my laptop, which is 7 years old. I figured at some point, I’d get a new laptop and better webcam. Well, it turns out that even the latest laptops have the same low webcam resolution (1280x720p) and smart phones have had better camera resolutions (1920x1080p) for years. My friend pointed this out to me the other day. (I believe her exact words were, “My god, Mach, your videos are terrible quality. You should use your phone.”)

So, I went to the store and found a handy kit that came with a tripod, smartphone adapter, and fancy ring light. And I made this silly video to test it out. I’m not entirely sure it’s better with the new setup because the softer resolution and darker lighting were a little more … forgiving. But we must move ever onward!

Anyways, I hope you’re happy, Maria.