
A couple weeks ago, I tried to make some predictions on how things might go depending on whether we continued isolating or not. How did it go? Well, for the most part, the U.S. has adhered to isolating and it really showed when looking at the graph of growth rate (the dots almost completely overlap the “No Action” prediction):
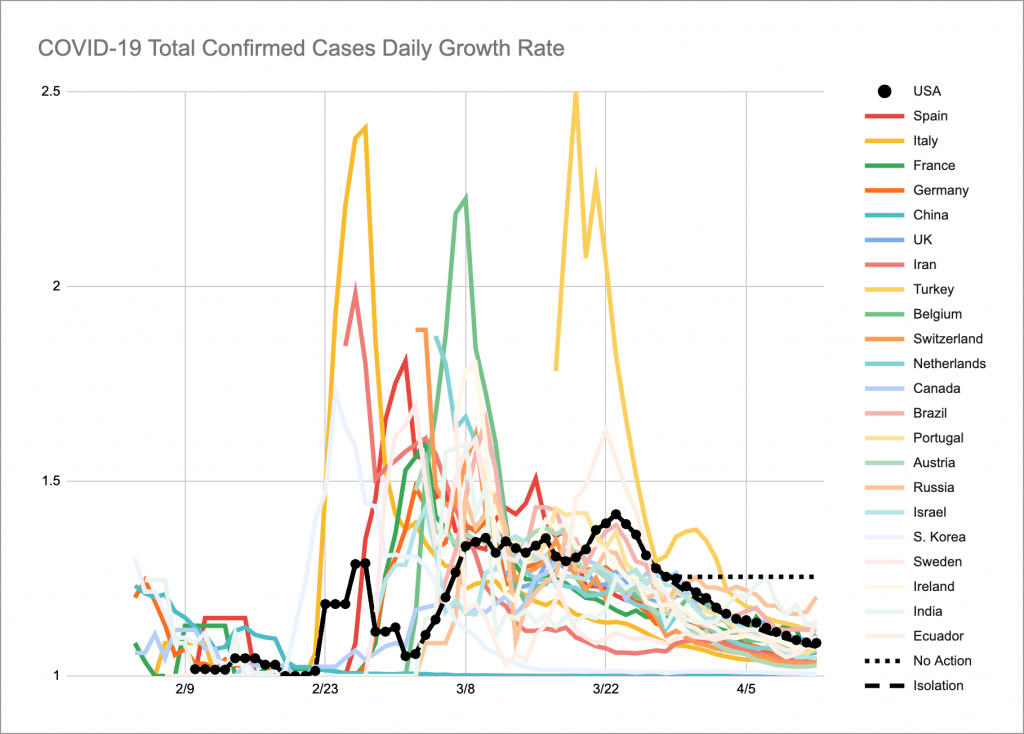
The two weeks went almost exactly how I imagined, which was:
Gn = (Gn-1 – 1)/(Gn-2 – 1) * (Gn-1 – 1) + 1
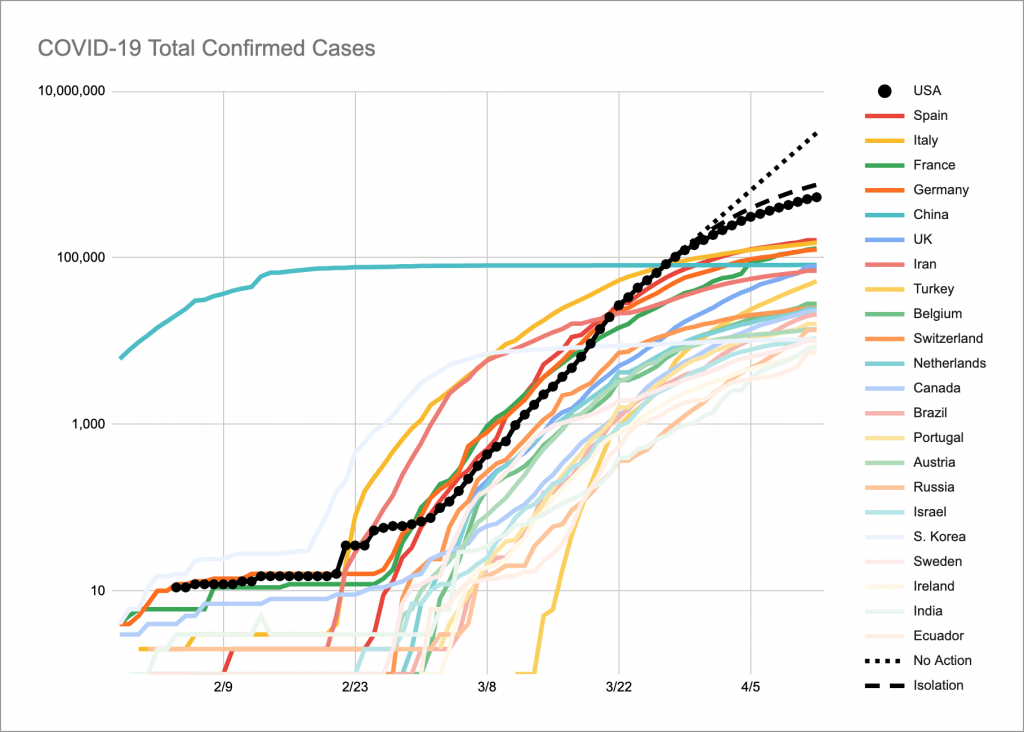
Or in other words, a function that geometrically decayed towards 1. That’s great news as it means that if we continue holding out, we’re over the inflection point. Similarly, the total number of cases was pretty close as well:
Unfortunately, my prediction for “lethality” didn’t turn out as well as I had hoped:
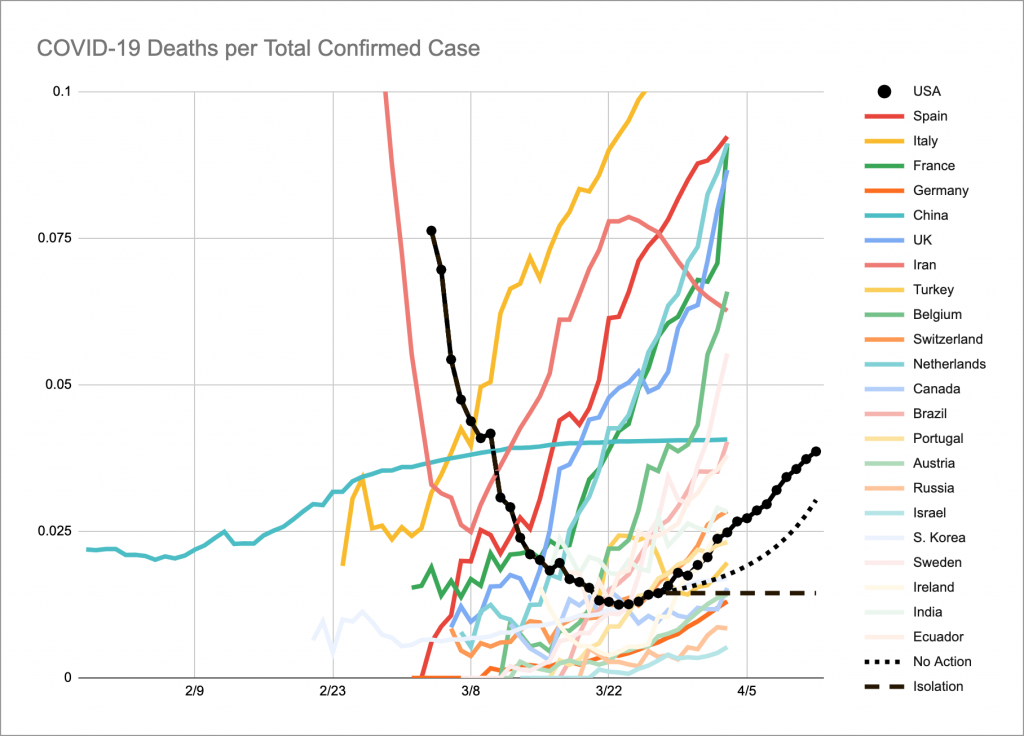
In hindsight, this makes sense. Even if we were perfectly isolated, it would have taken a few days for that to reflect in the numbers for people who already had it. We can see that better in the graph for total number of deaths:
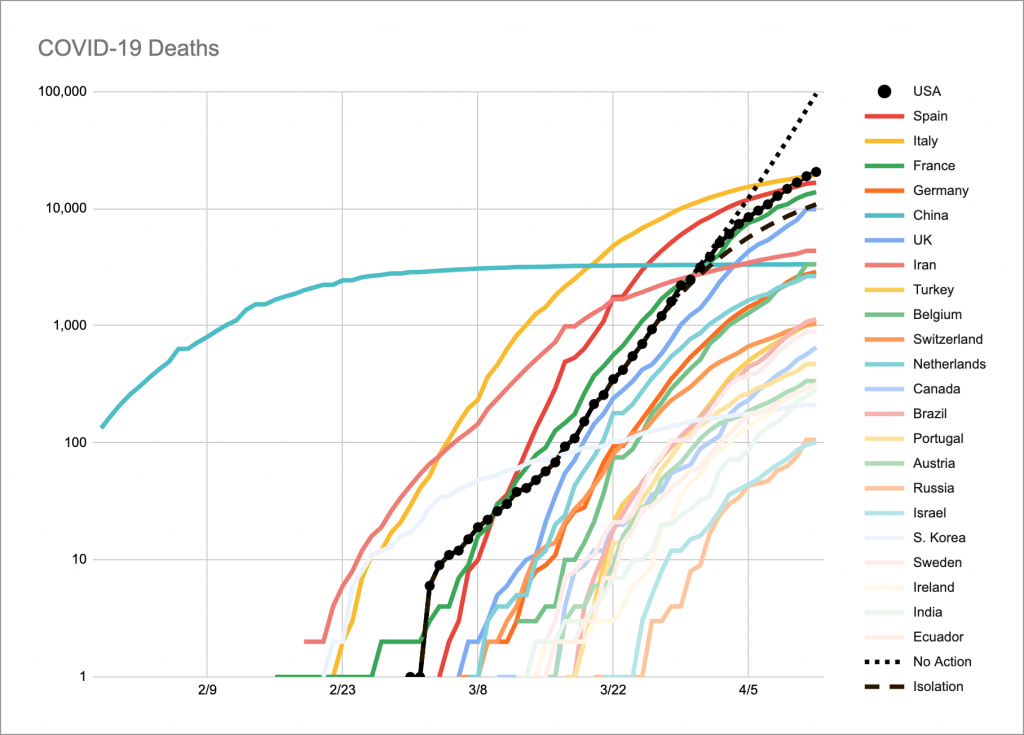
The graph is starting to taper, but it took a few more days for it to taper than I had initially hoped. Still, it’s been getting better. So I think we’ve avoided the worst of it. The bigger question is how long can we hold out? What will the world look like when this is over?