Archive for May, 2020

Hardware Archeology: Sony CLIÉ

Sunday, May 31st, 2020

I went into the garage and found a couple more of my old devices. These were PDAs (Personal Digital Assistants) from around 2002-2004, which is what people had before there were smartphones. They were significantly less powerful (no internet or multi-touch) but surprisingly similar (color display, touchscreen, and apps for things like calendar, notes, etc.).

The first one I had was the Sony CLIÉ PEG-T615C. Two of the coolest features were the jog-dial (sorta like a mouse scroll wheel) and a dedicated non-display touch area that you could scribble on to input characters. It wasn’t as fast as typing but more convenient than trying to peck tiny buttons on the screen.

I got the Sony CLIÉ PEG-TG50 a couple years later and it had several big upgrades: its own physical keyboard, a microphone, and it could play audio. Also, I wrote a few programs for it.

One was another implementation of the card game Set. This was a significant improvement over my HP 48GX implementation in that it made use of the color display and the fact that it had a whopping 12.2 times as many pixels.

Another was a simple implementation of the PSP game Lumines. A friend had it on the PSP and I loved that game. Unfortunately, I didn’t have a PSP. But I did have an awesome PDA with a jog dial and a touch screen so I attempted to see if I could make a version of it on my CLIÉ. It’s been so long that I don’t remember what I wrote it in, but it was probably C++.


Hardware Archeology: HP 48GX

Sunday, May 24th, 2020

Back in college, programmable calculators were starting to become a thing and by the time I hit grad school, the HP 48GX came out. It was the closest thing to a handheld computer that I’d ever had.

For the time, it was truly impressive. It could do all the standard calculator functions but it could also run simple programs and I wrote a few.

One in particular that I was pretty proud of was an implementation of a card game called Set. It’s based on trying to find sets of 3 cards that are all the same or all different in 4 categories: number, color, shape, and pattern. But the HP 48GX, as advanced as it was, was only black and white and had very low resolution (131×64 pixels). So I simplified the shapes and instead of colors, I re-used the pattern in the background of the shapes.

It worked out pretty well. The funny thing was that the processor on the calculator was so slow that I couldn’t check all the possible combinations very quickly. Instead it just checked for one combination per loop and it was possible for a human player to actually find a set before the calculator.

I managed to dig up my old calculator and was amazed to find it still worked when I put in some fresh batteries. Unfortunately, the memory was wiped but I found an archive of my old HP 48GX work and still have the original program and readme.txt file.

Reddit Tracking

Friday, May 22nd, 2020

I occasionally post on Reddit and the other day, I posted that admitting you’re wrong is a sign of growth, not weakness and it got pretty popular. Then it got deleted because apparently, the mods thought it was common sense. I disagree, but it’s their group so fair enough.

So then I thought it would have been interesting to see how the post’s popularity changed over time. But I don’t think Reddit keeps track of that kind of information. So I wrote a super hacky script to do just that. Then I ran it whenever I made another post and eventually made a post (about the difference between addictive and fun) that was moderately popular. I tracked it over 24 hours (with some breaks because the script crashed a few times; like I said, it’s super hacky) and that’s the blue graph.

So then I thought it would be kinda neat to post a graph to Reddit that tracked the popularity of the post itself! Unfortunately, images can’t be changed once posted. But if you post a link to an article with the image, Reddit extracts the image. So if you update an image in an article, would the image update on the Reddit post? I don’t know. But that’s what this blog post is attempting to find out.

Which States are Recovering?

Thursday, May 7th, 2020

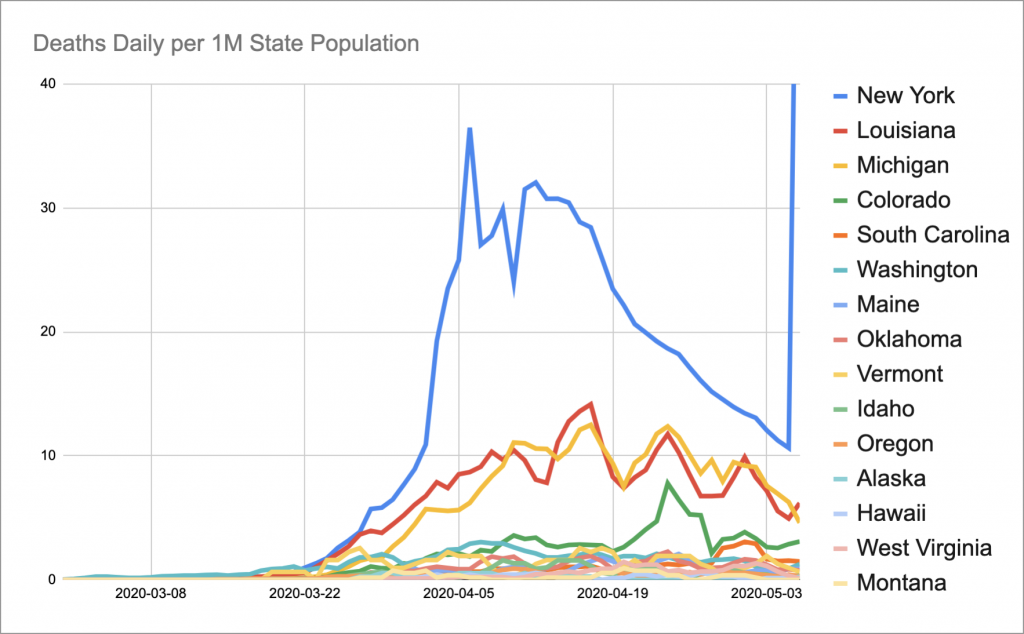
I’ve been looking at the COVID-19 dataset from the New York Times GitHub repository trying to get a sense of how states are doing and which ones are recovering. I wrote a little script to collate the data, put it all into a spreadsheet, and came up with this graph:

These are the states whose daily death counts have dropped to half of their maximum. (The spike at the end for New York is due to a large number of nursing home deaths that were finally added to the data, so hopefully it’s just a one-time correction.)

Most of the ones that are doing the best are very low population states except Hawaii and West Virginia. Hawaii is a special case because they’re an island and people flying in are quarantined for 14 days. This drastically cuts down on their tourist population so their beaches are naturally pretty empty compared to normal. As for the rest, they seemed to take their lockdown pretty seriously. So, long story short, the best strategies for fighting COVID-19 seem to be:

  • Have low population density.
  • Be an island and institute a 14-day quarantine.
  • Take lockdown seriously.