I went into the garage and found a couple more of my old devices. These were PDAs (Personal Digital Assistants) from around 2002-2004, which is what people had before there were smartphones. They were significantly less powerful (no internet or multi-touch) but surprisingly similar (color display, touchscreen, and apps for things like calendar, notes, etc.).
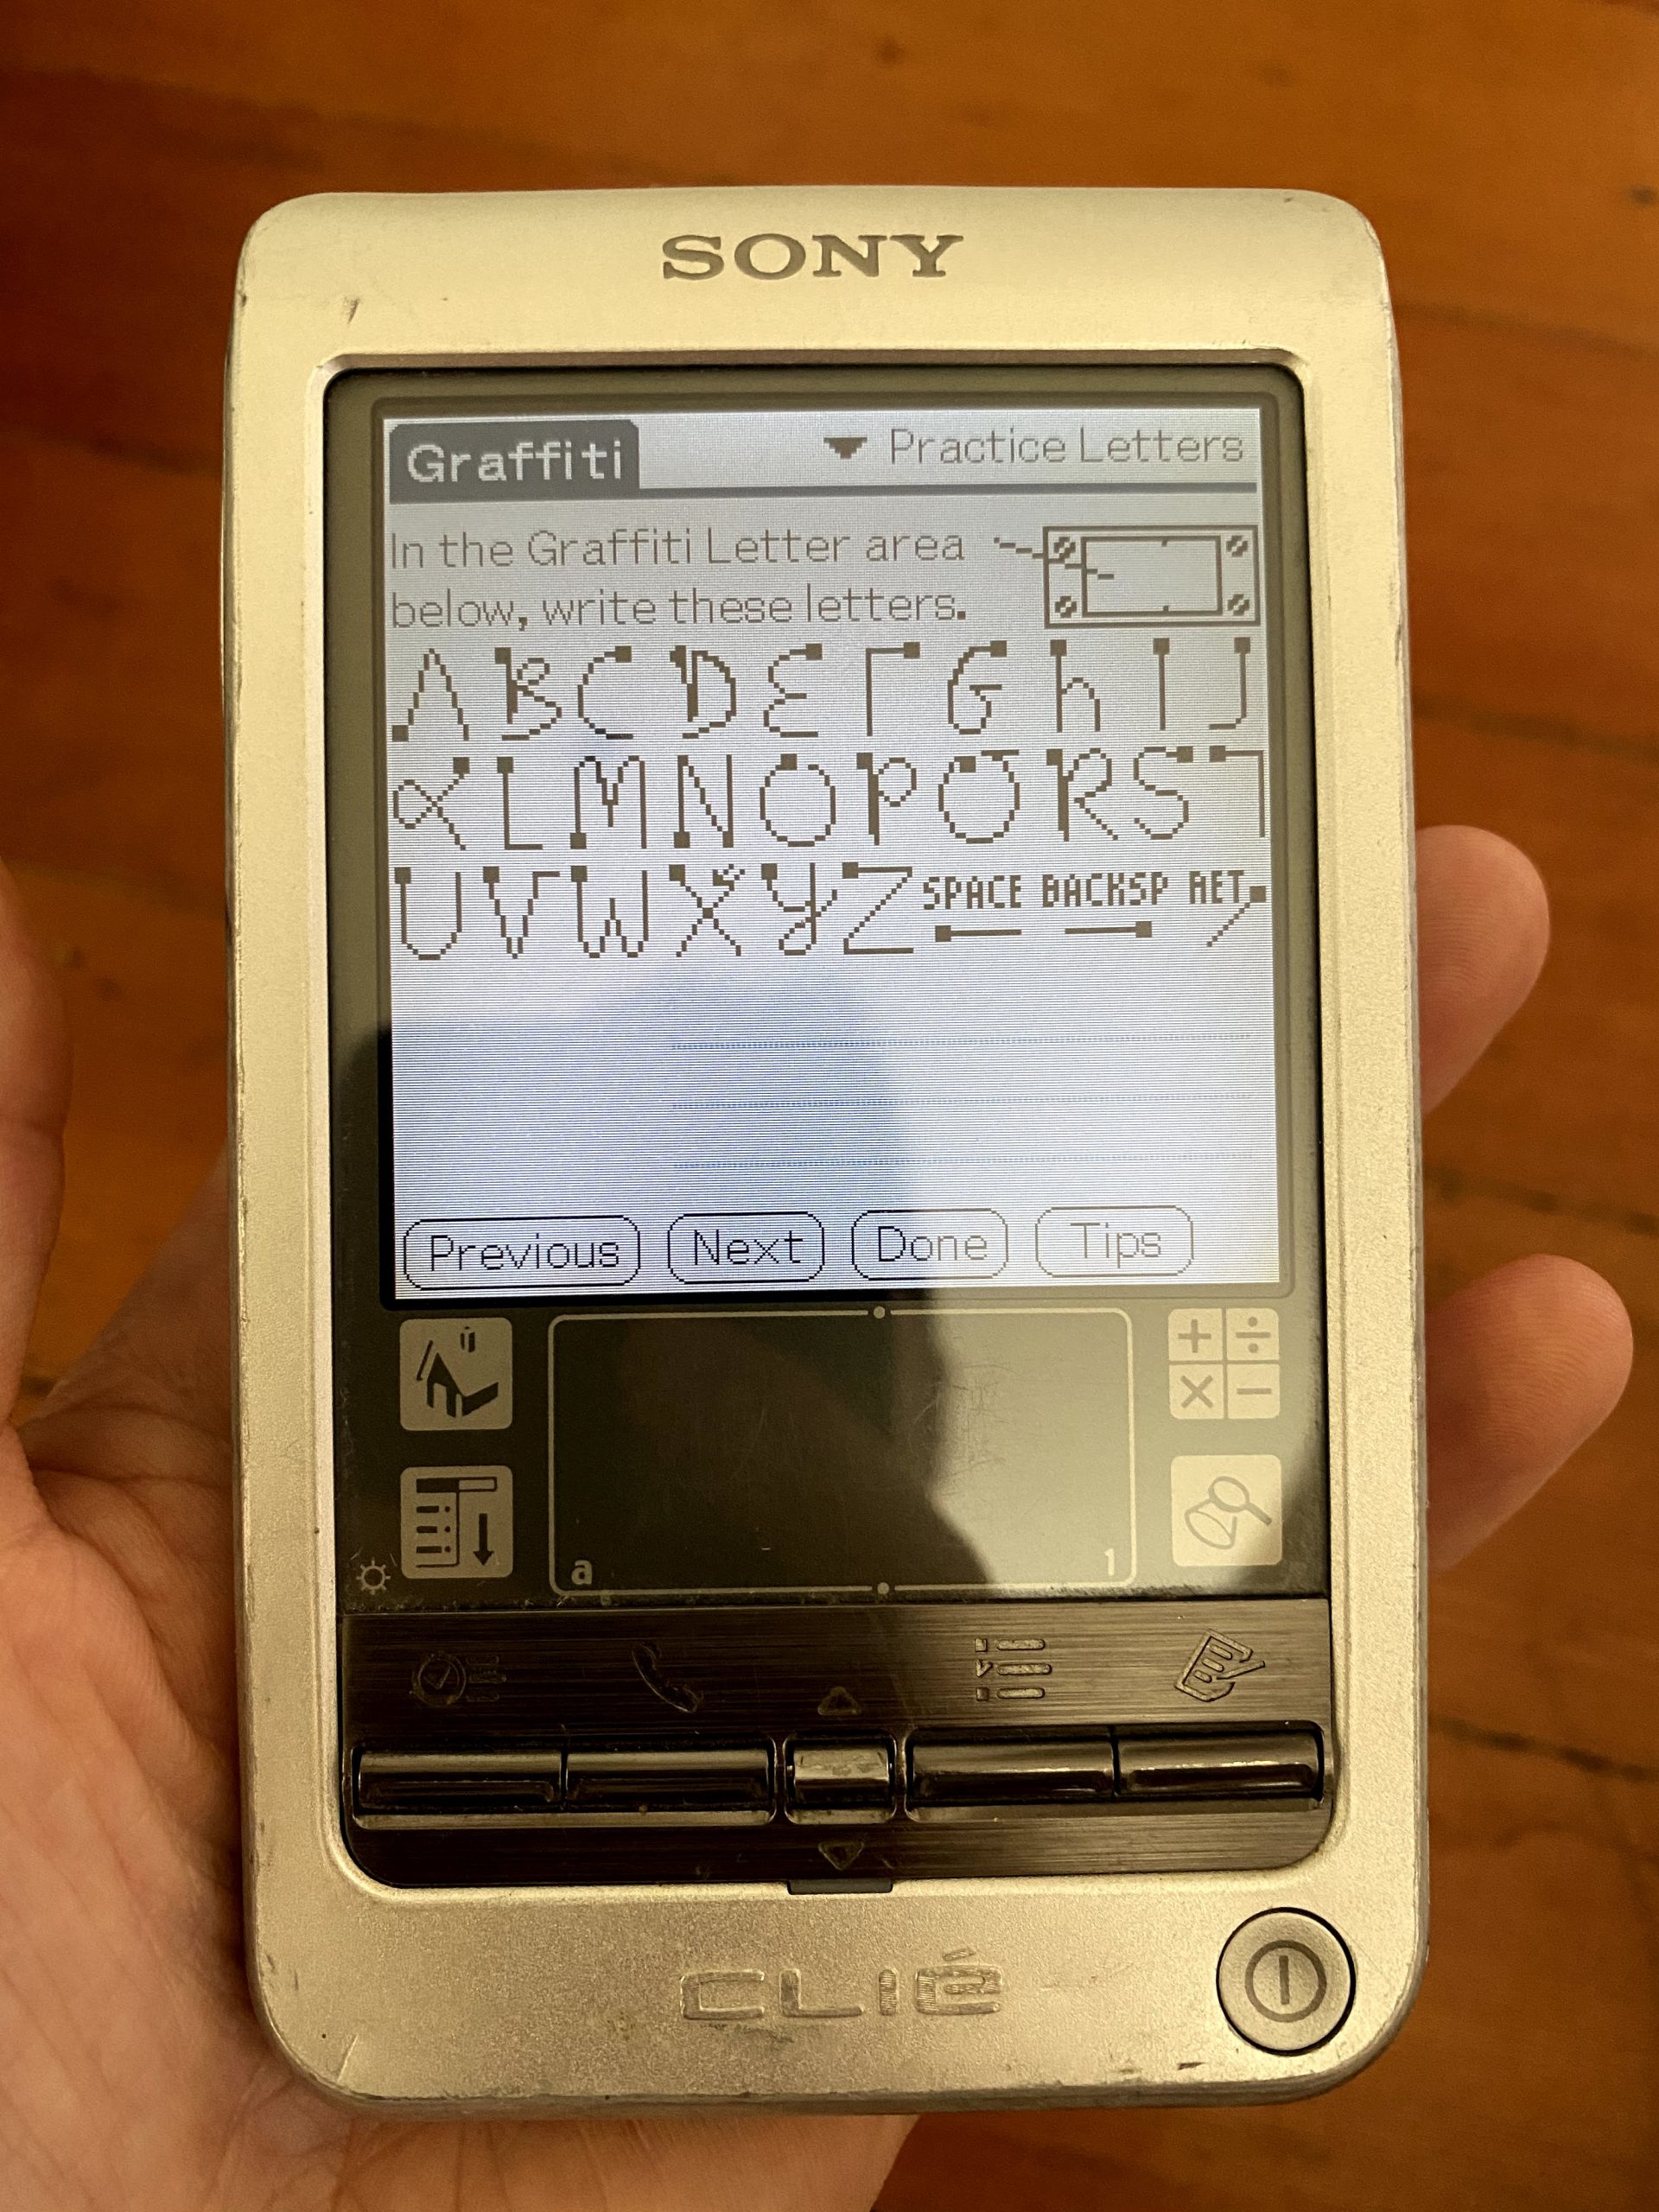
The first one I had was the Sony CLIÉ PEG-T615C. Two of the coolest features were the jog-dial (sorta like a mouse scroll wheel) and a dedicated non-display touch area that you could scribble on to input characters. It wasn’t as fast as typing but more convenient than trying to peck tiny buttons on the screen.
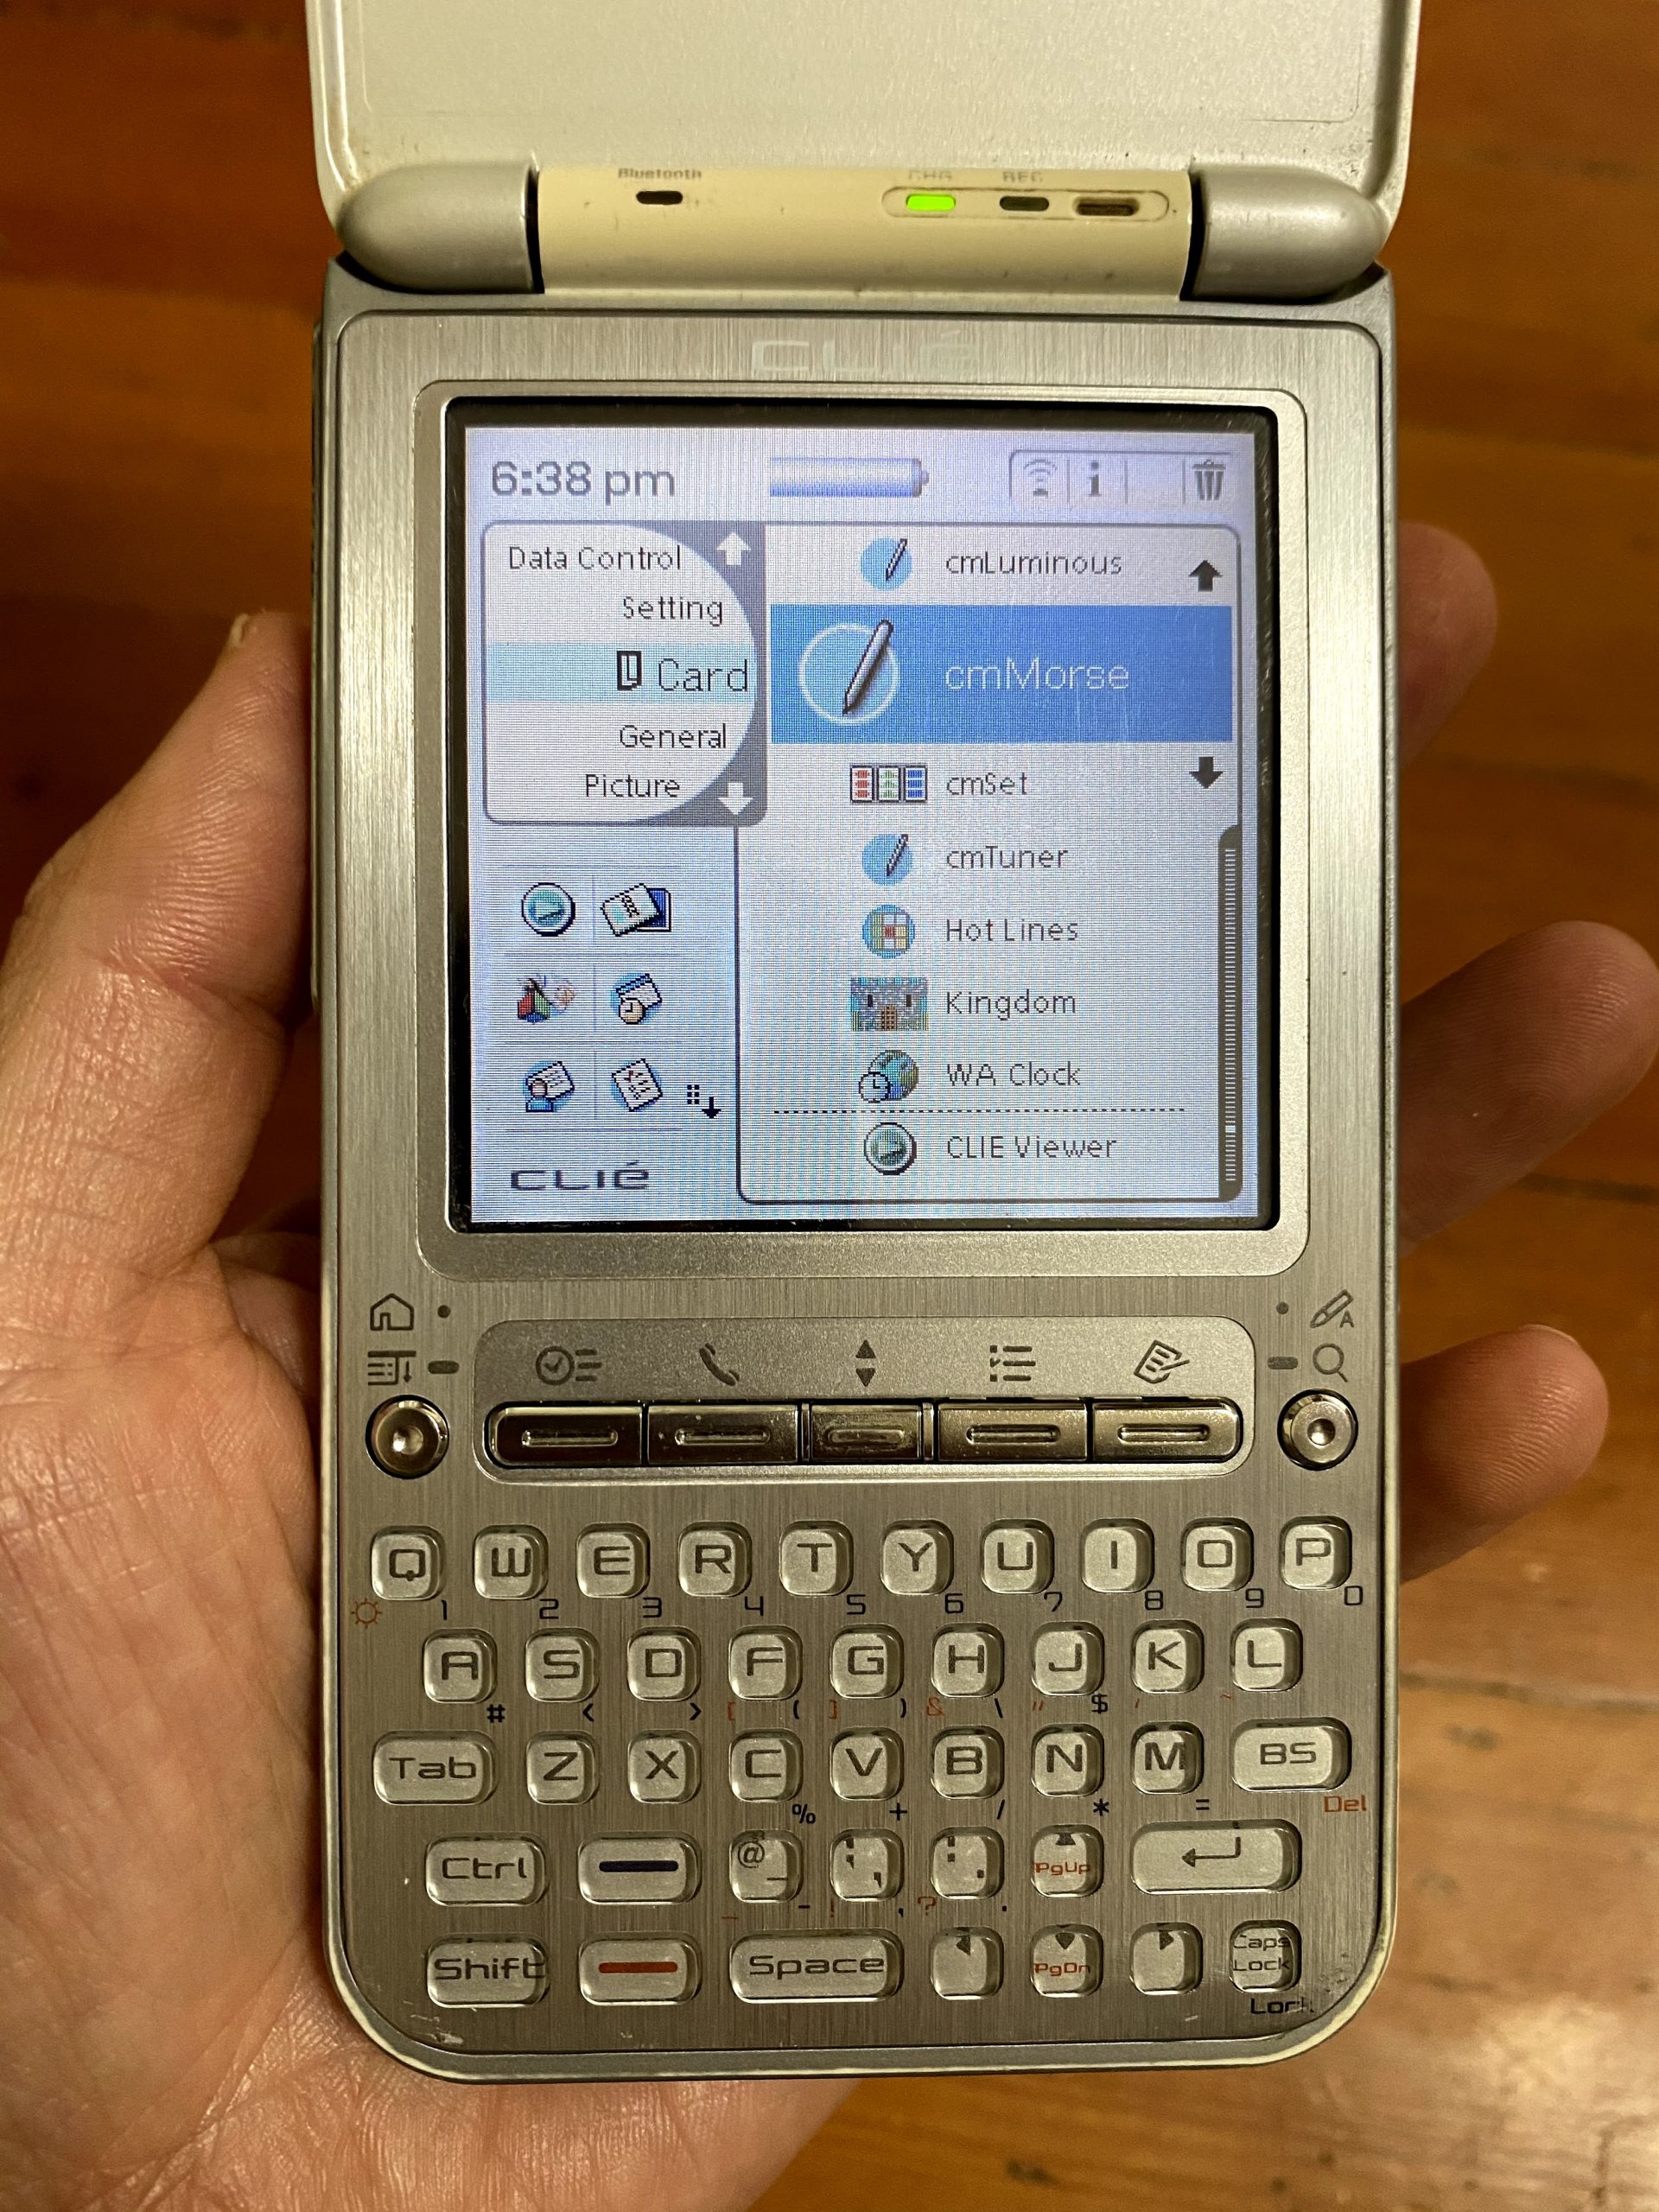
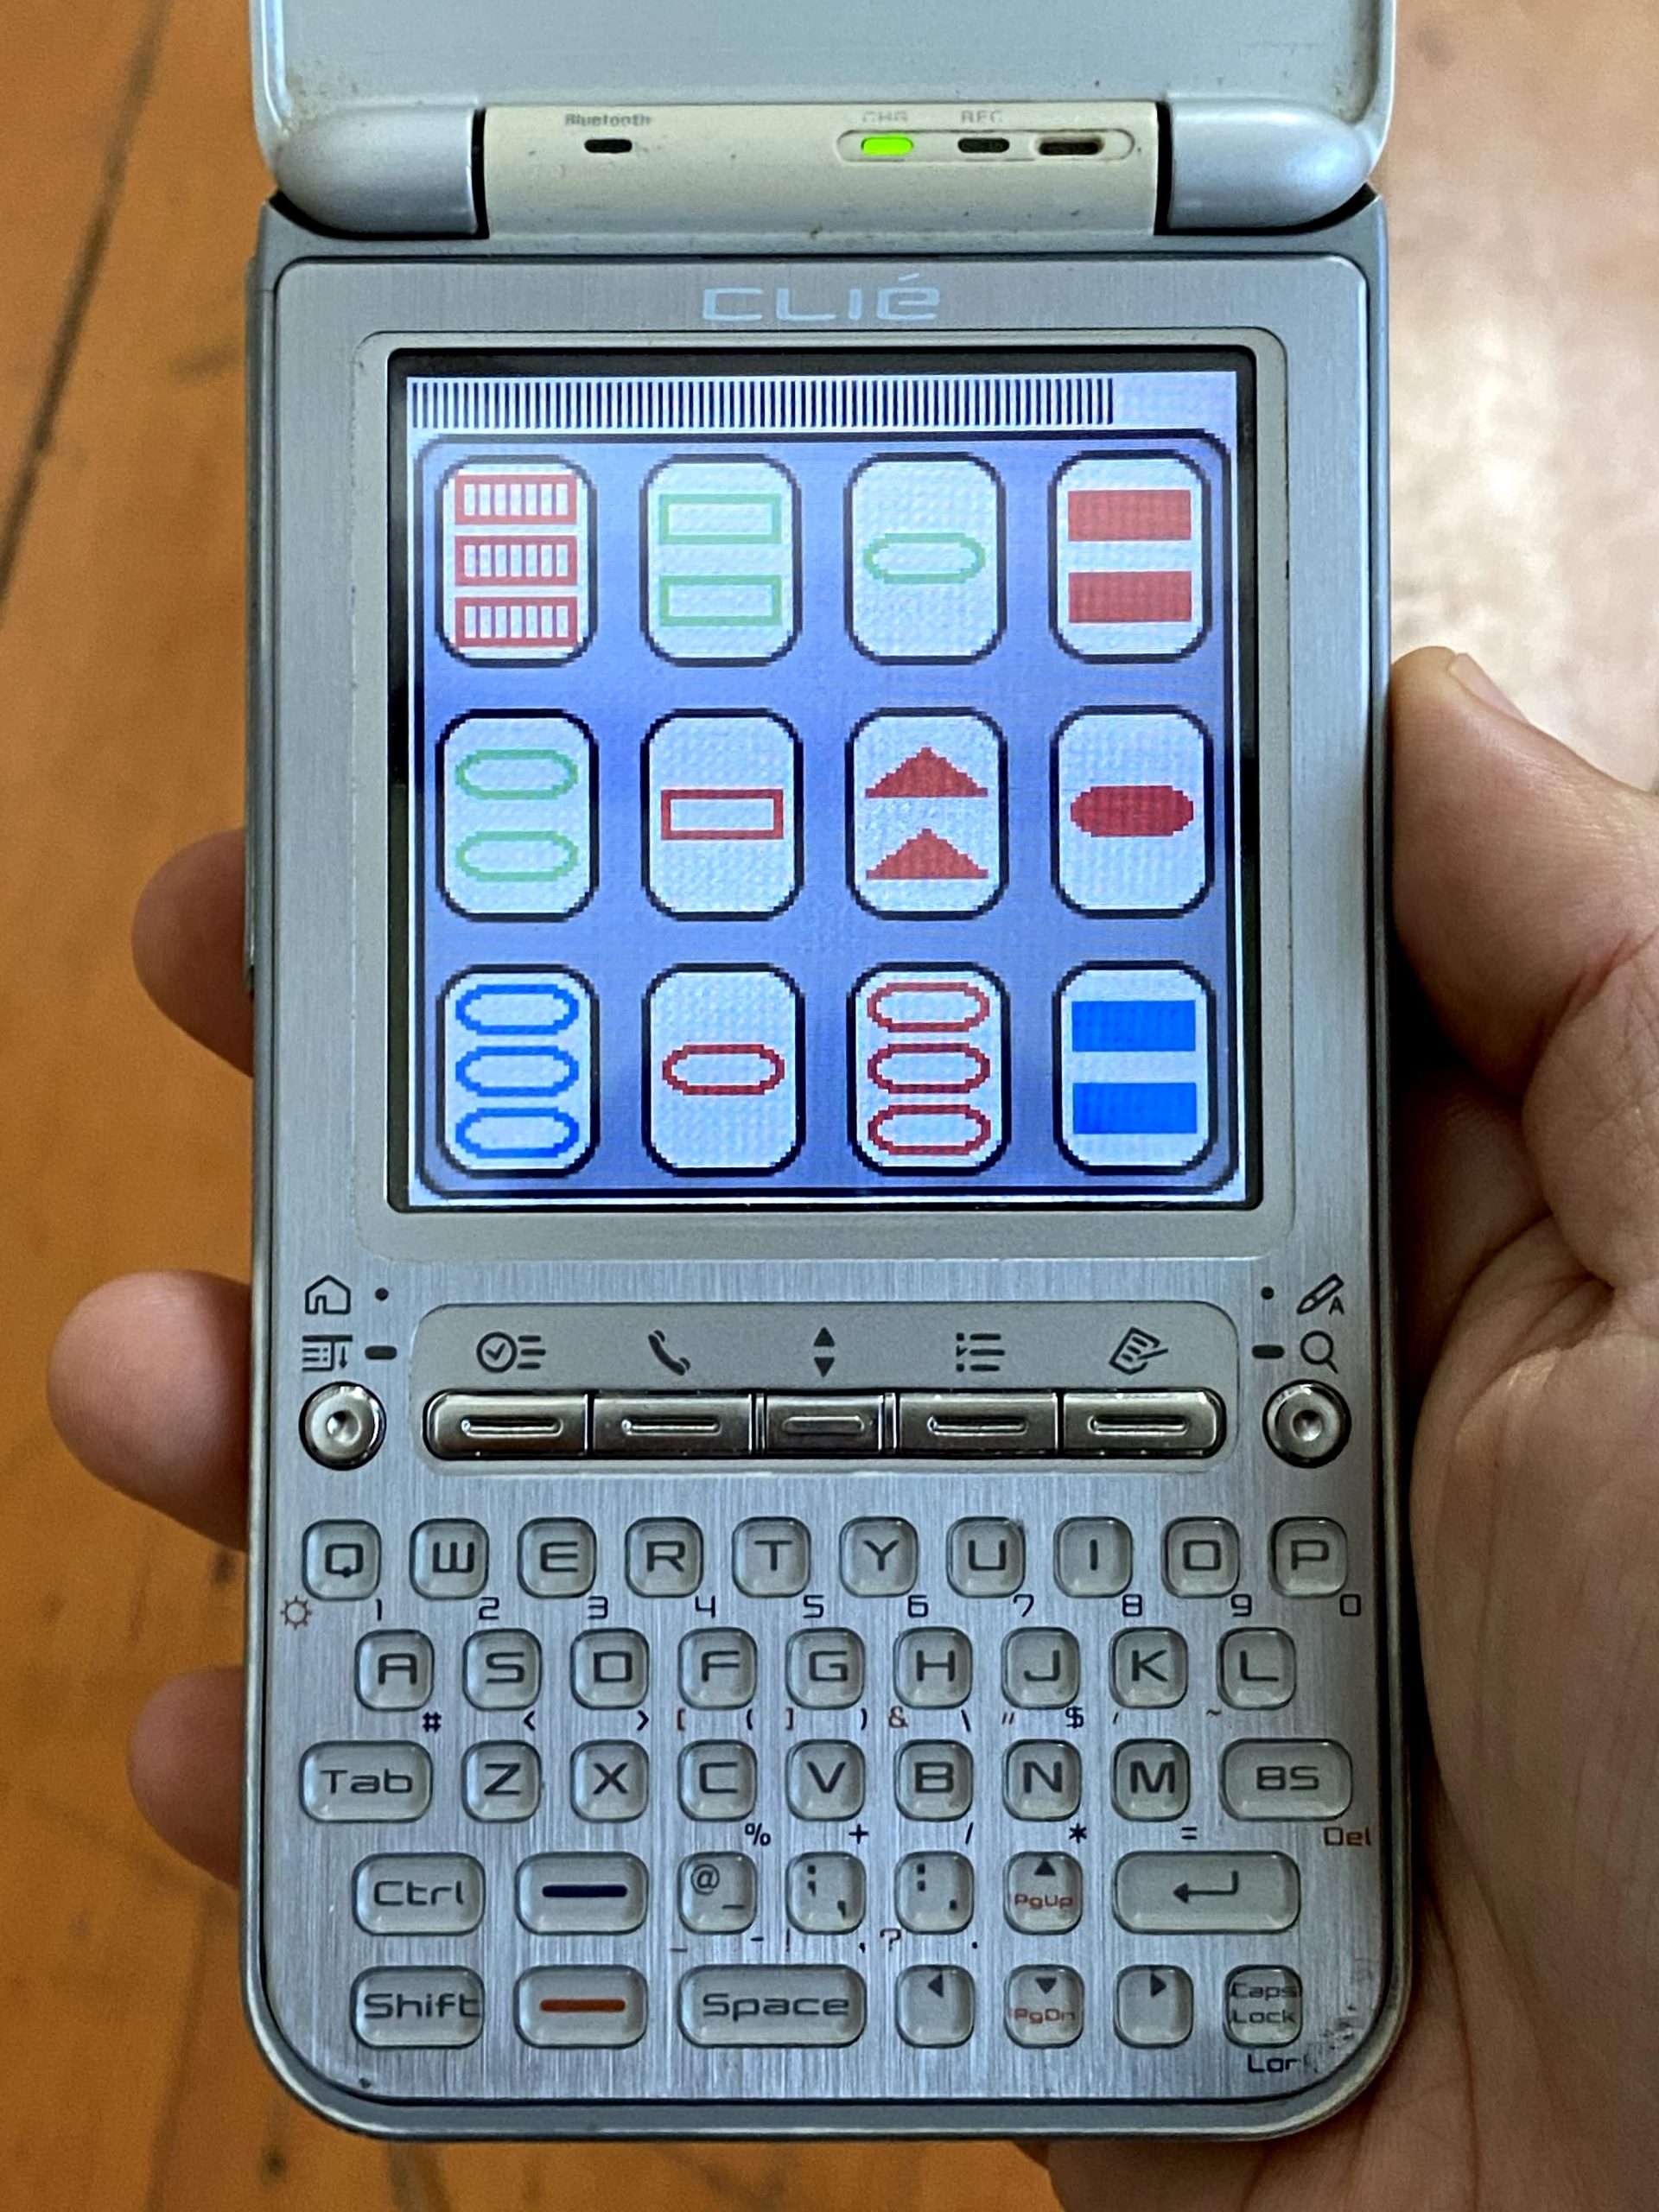
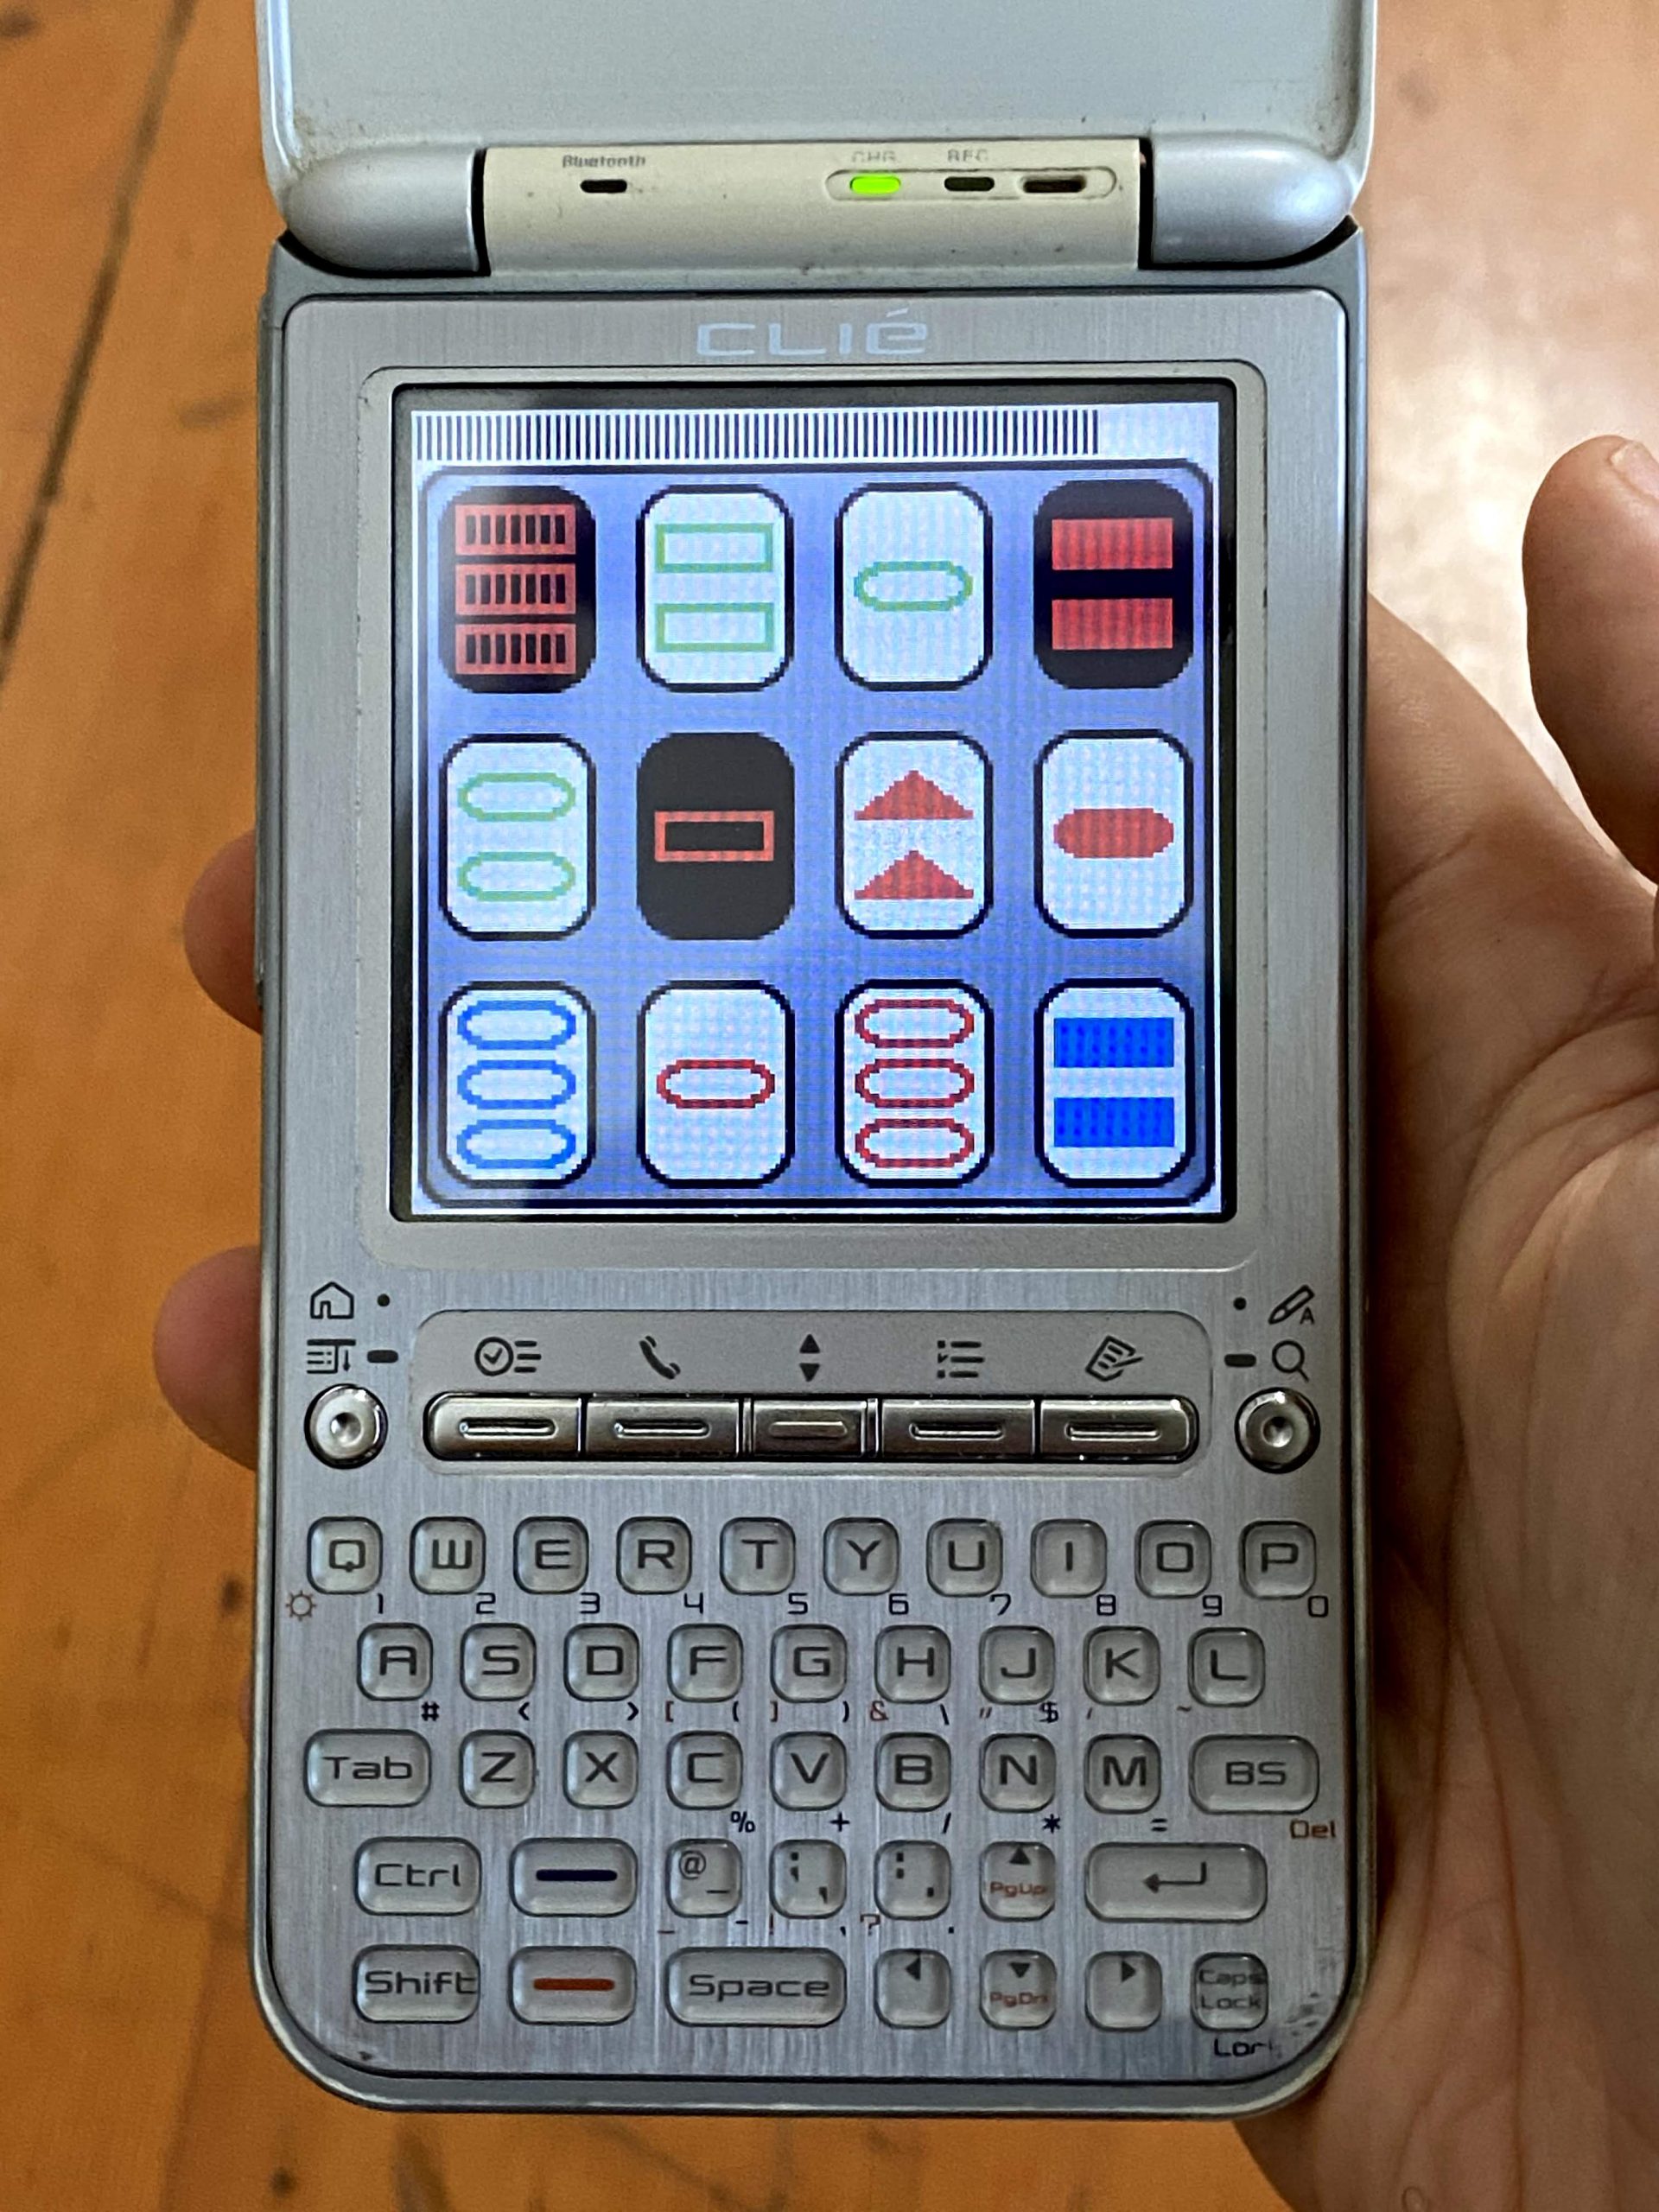
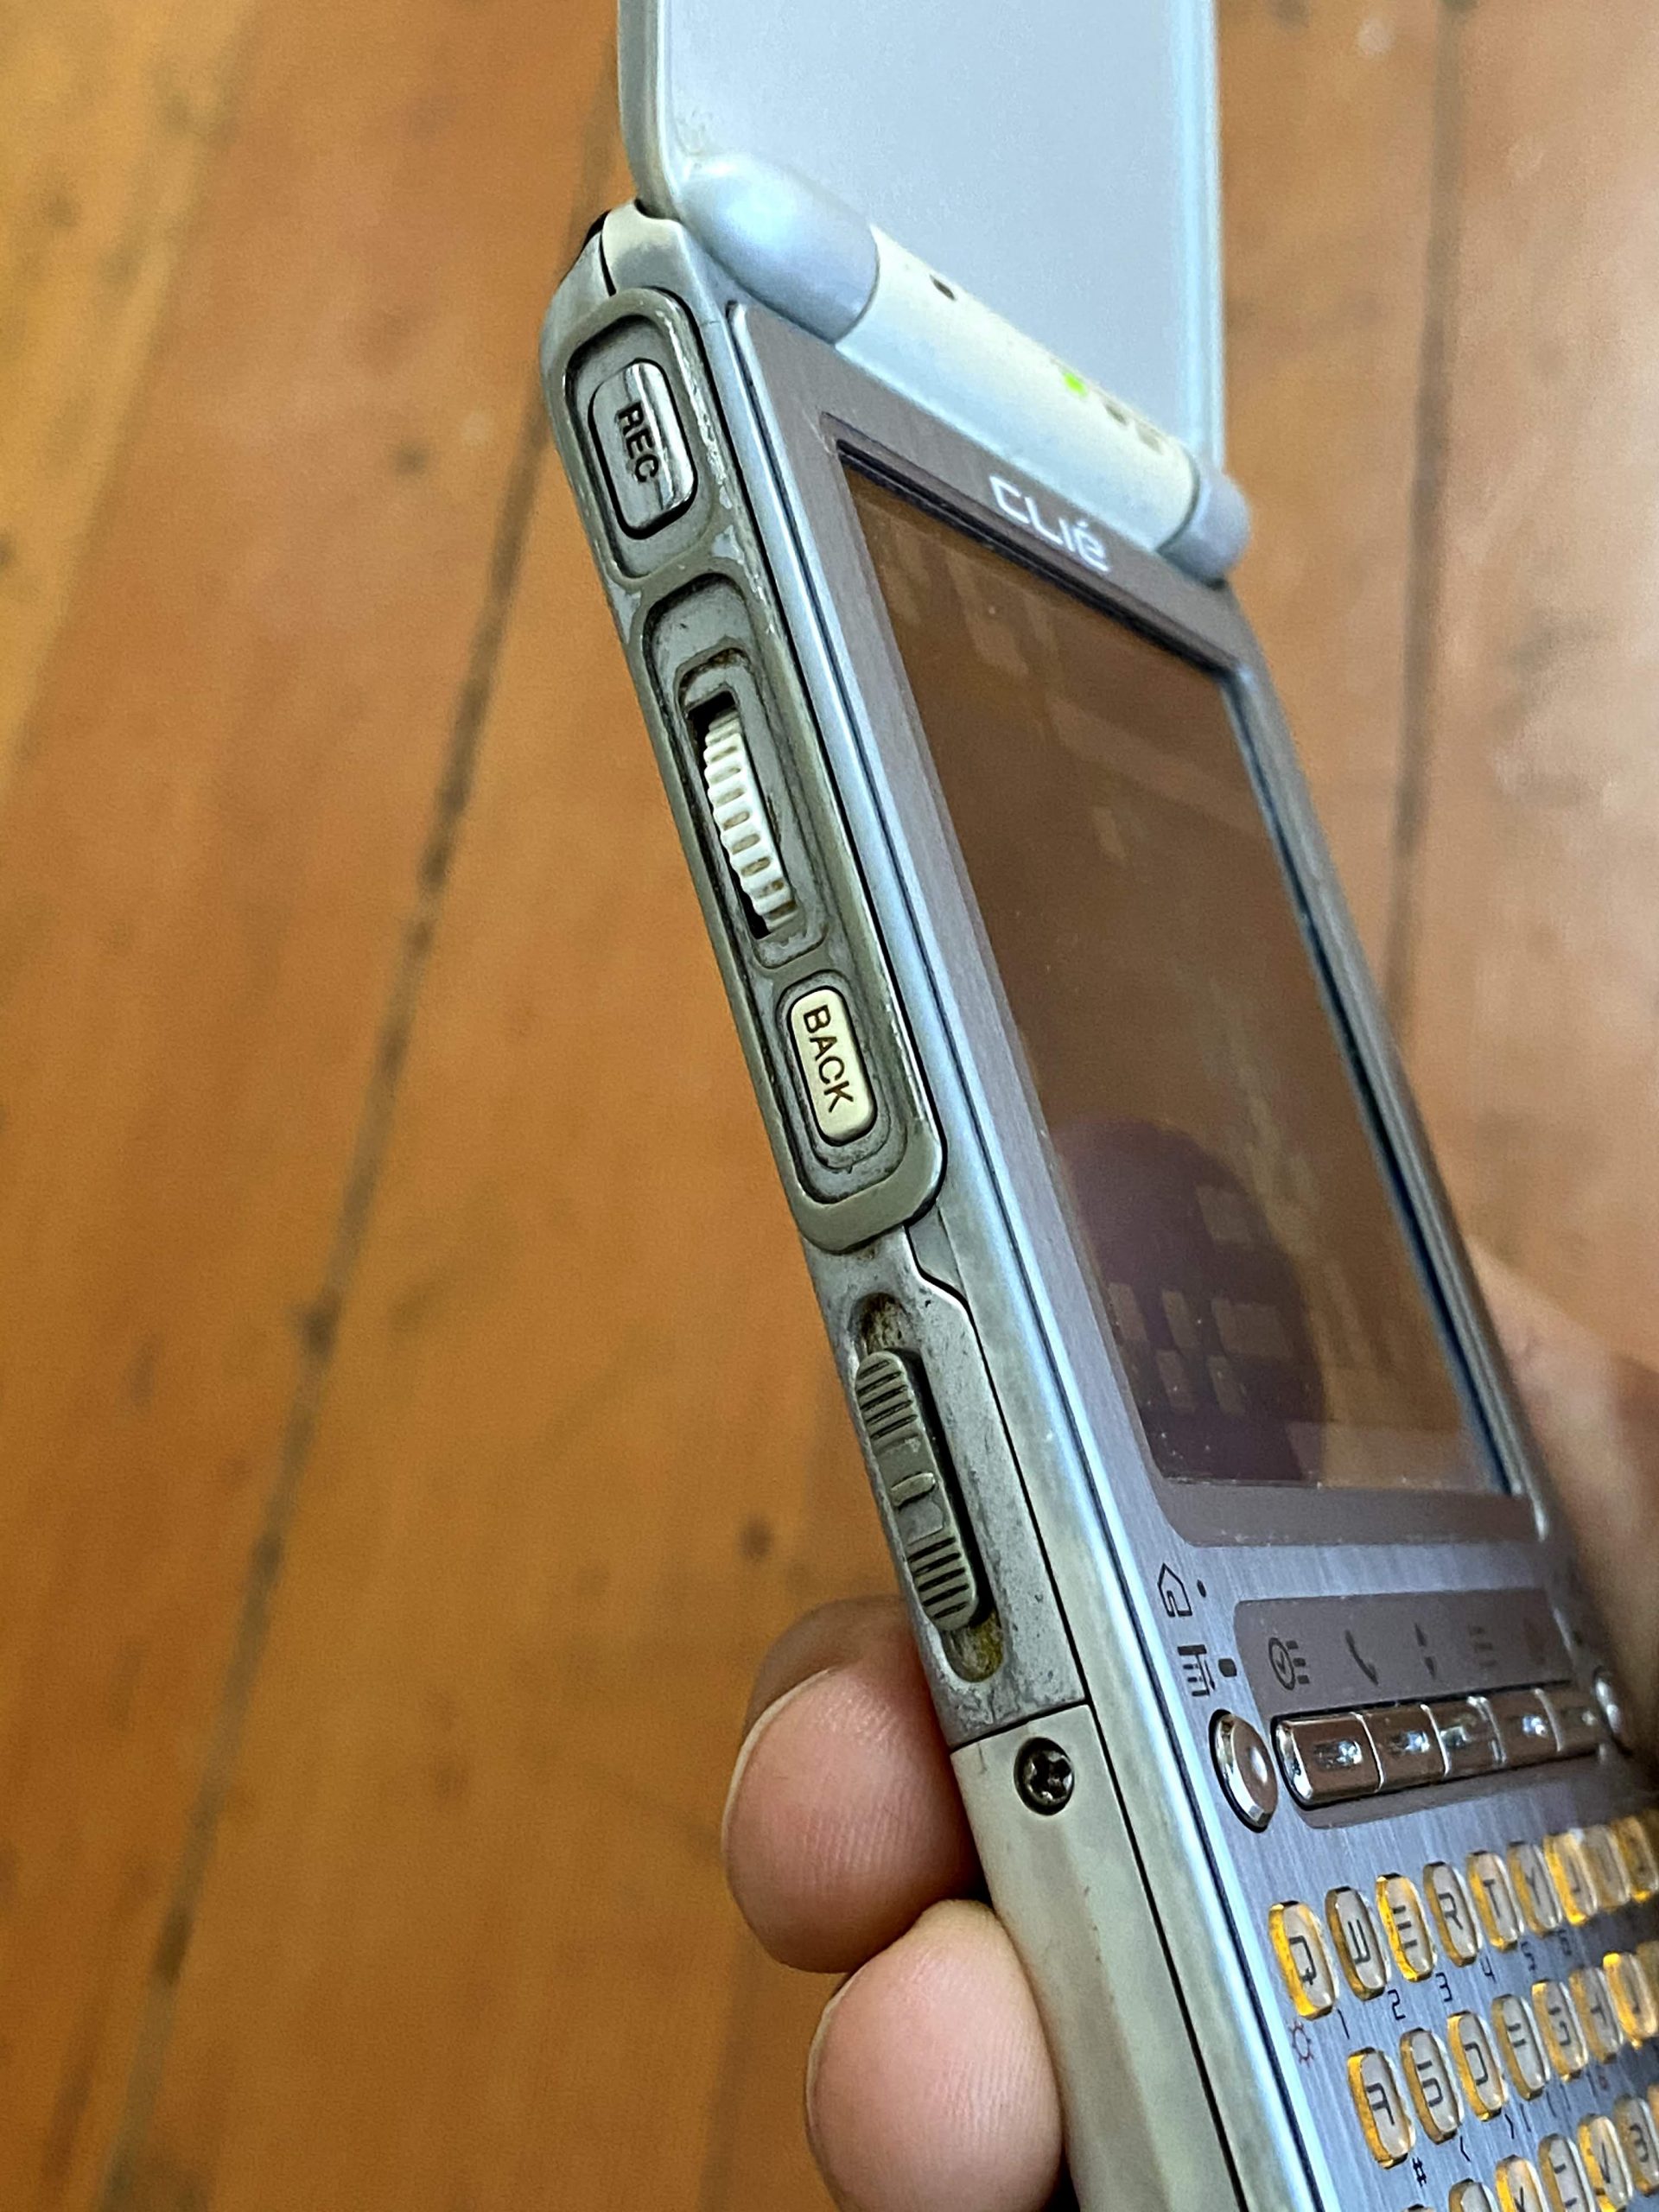
I got the Sony CLIÉ PEG-TG50 a couple years later and it had several big upgrades: its own physical keyboard, a microphone, and it could play audio. Also, I wrote a few programs for it.
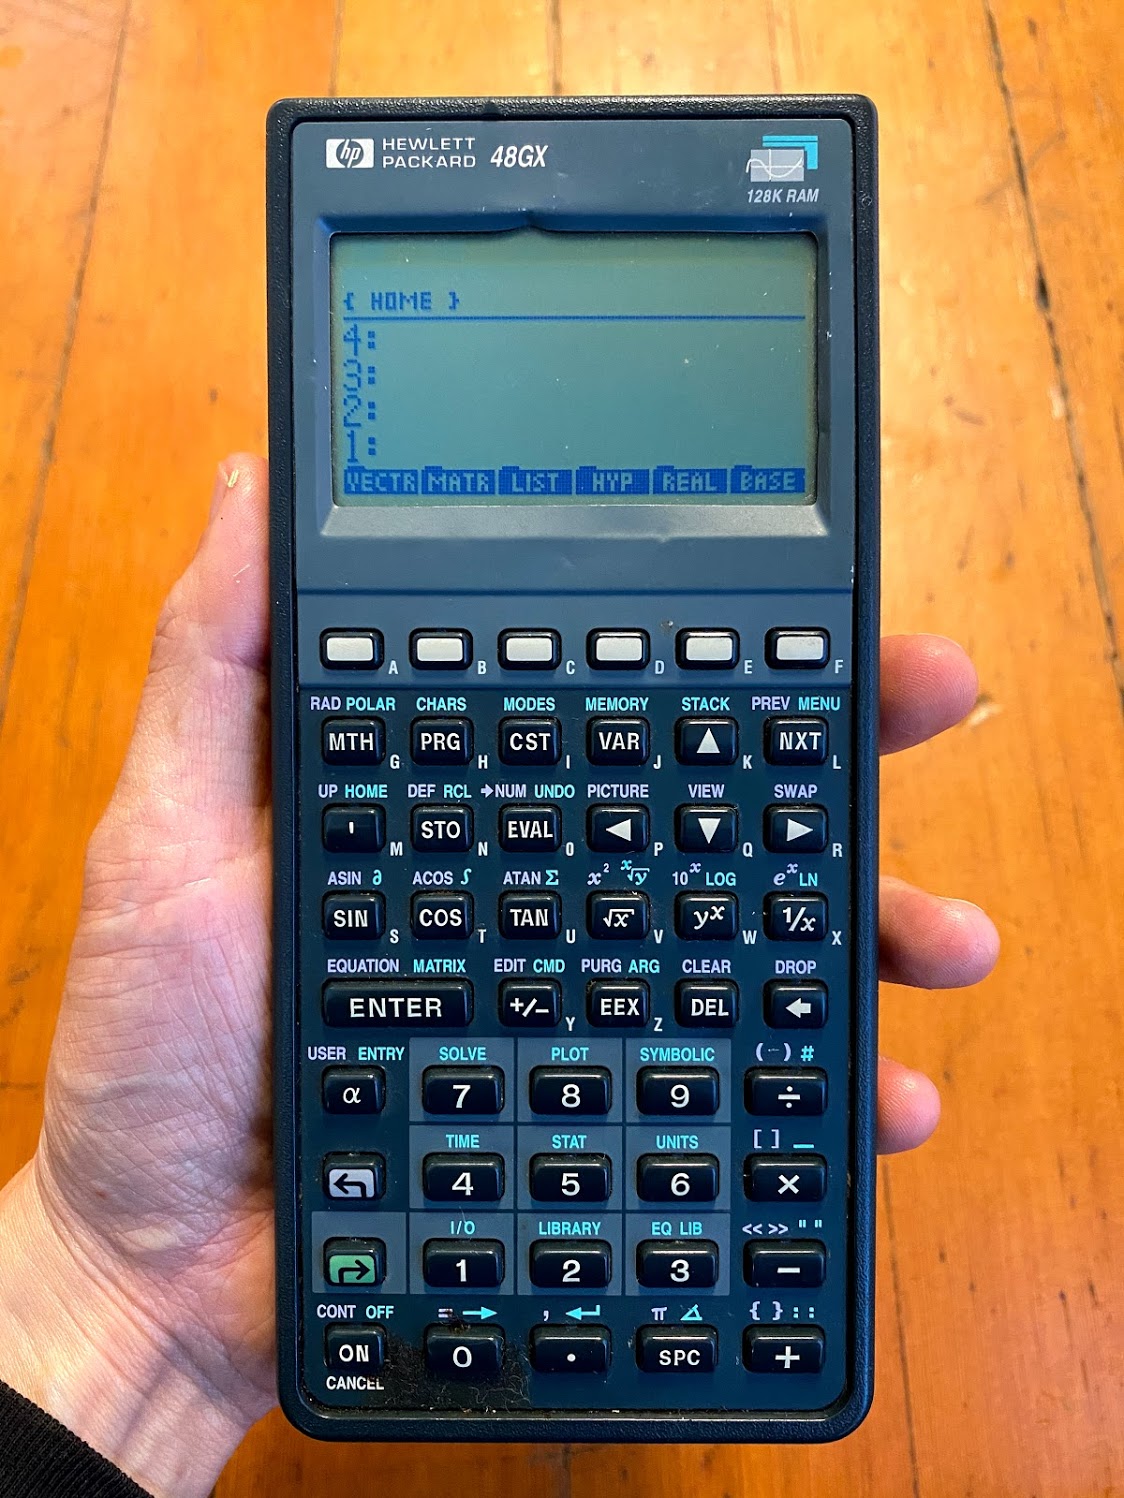
One was another implementation of the card game Set. This was a significant improvement over my HP 48GX implementation in that it made use of the color display and the fact that it had a whopping 12.2 times as many pixels.
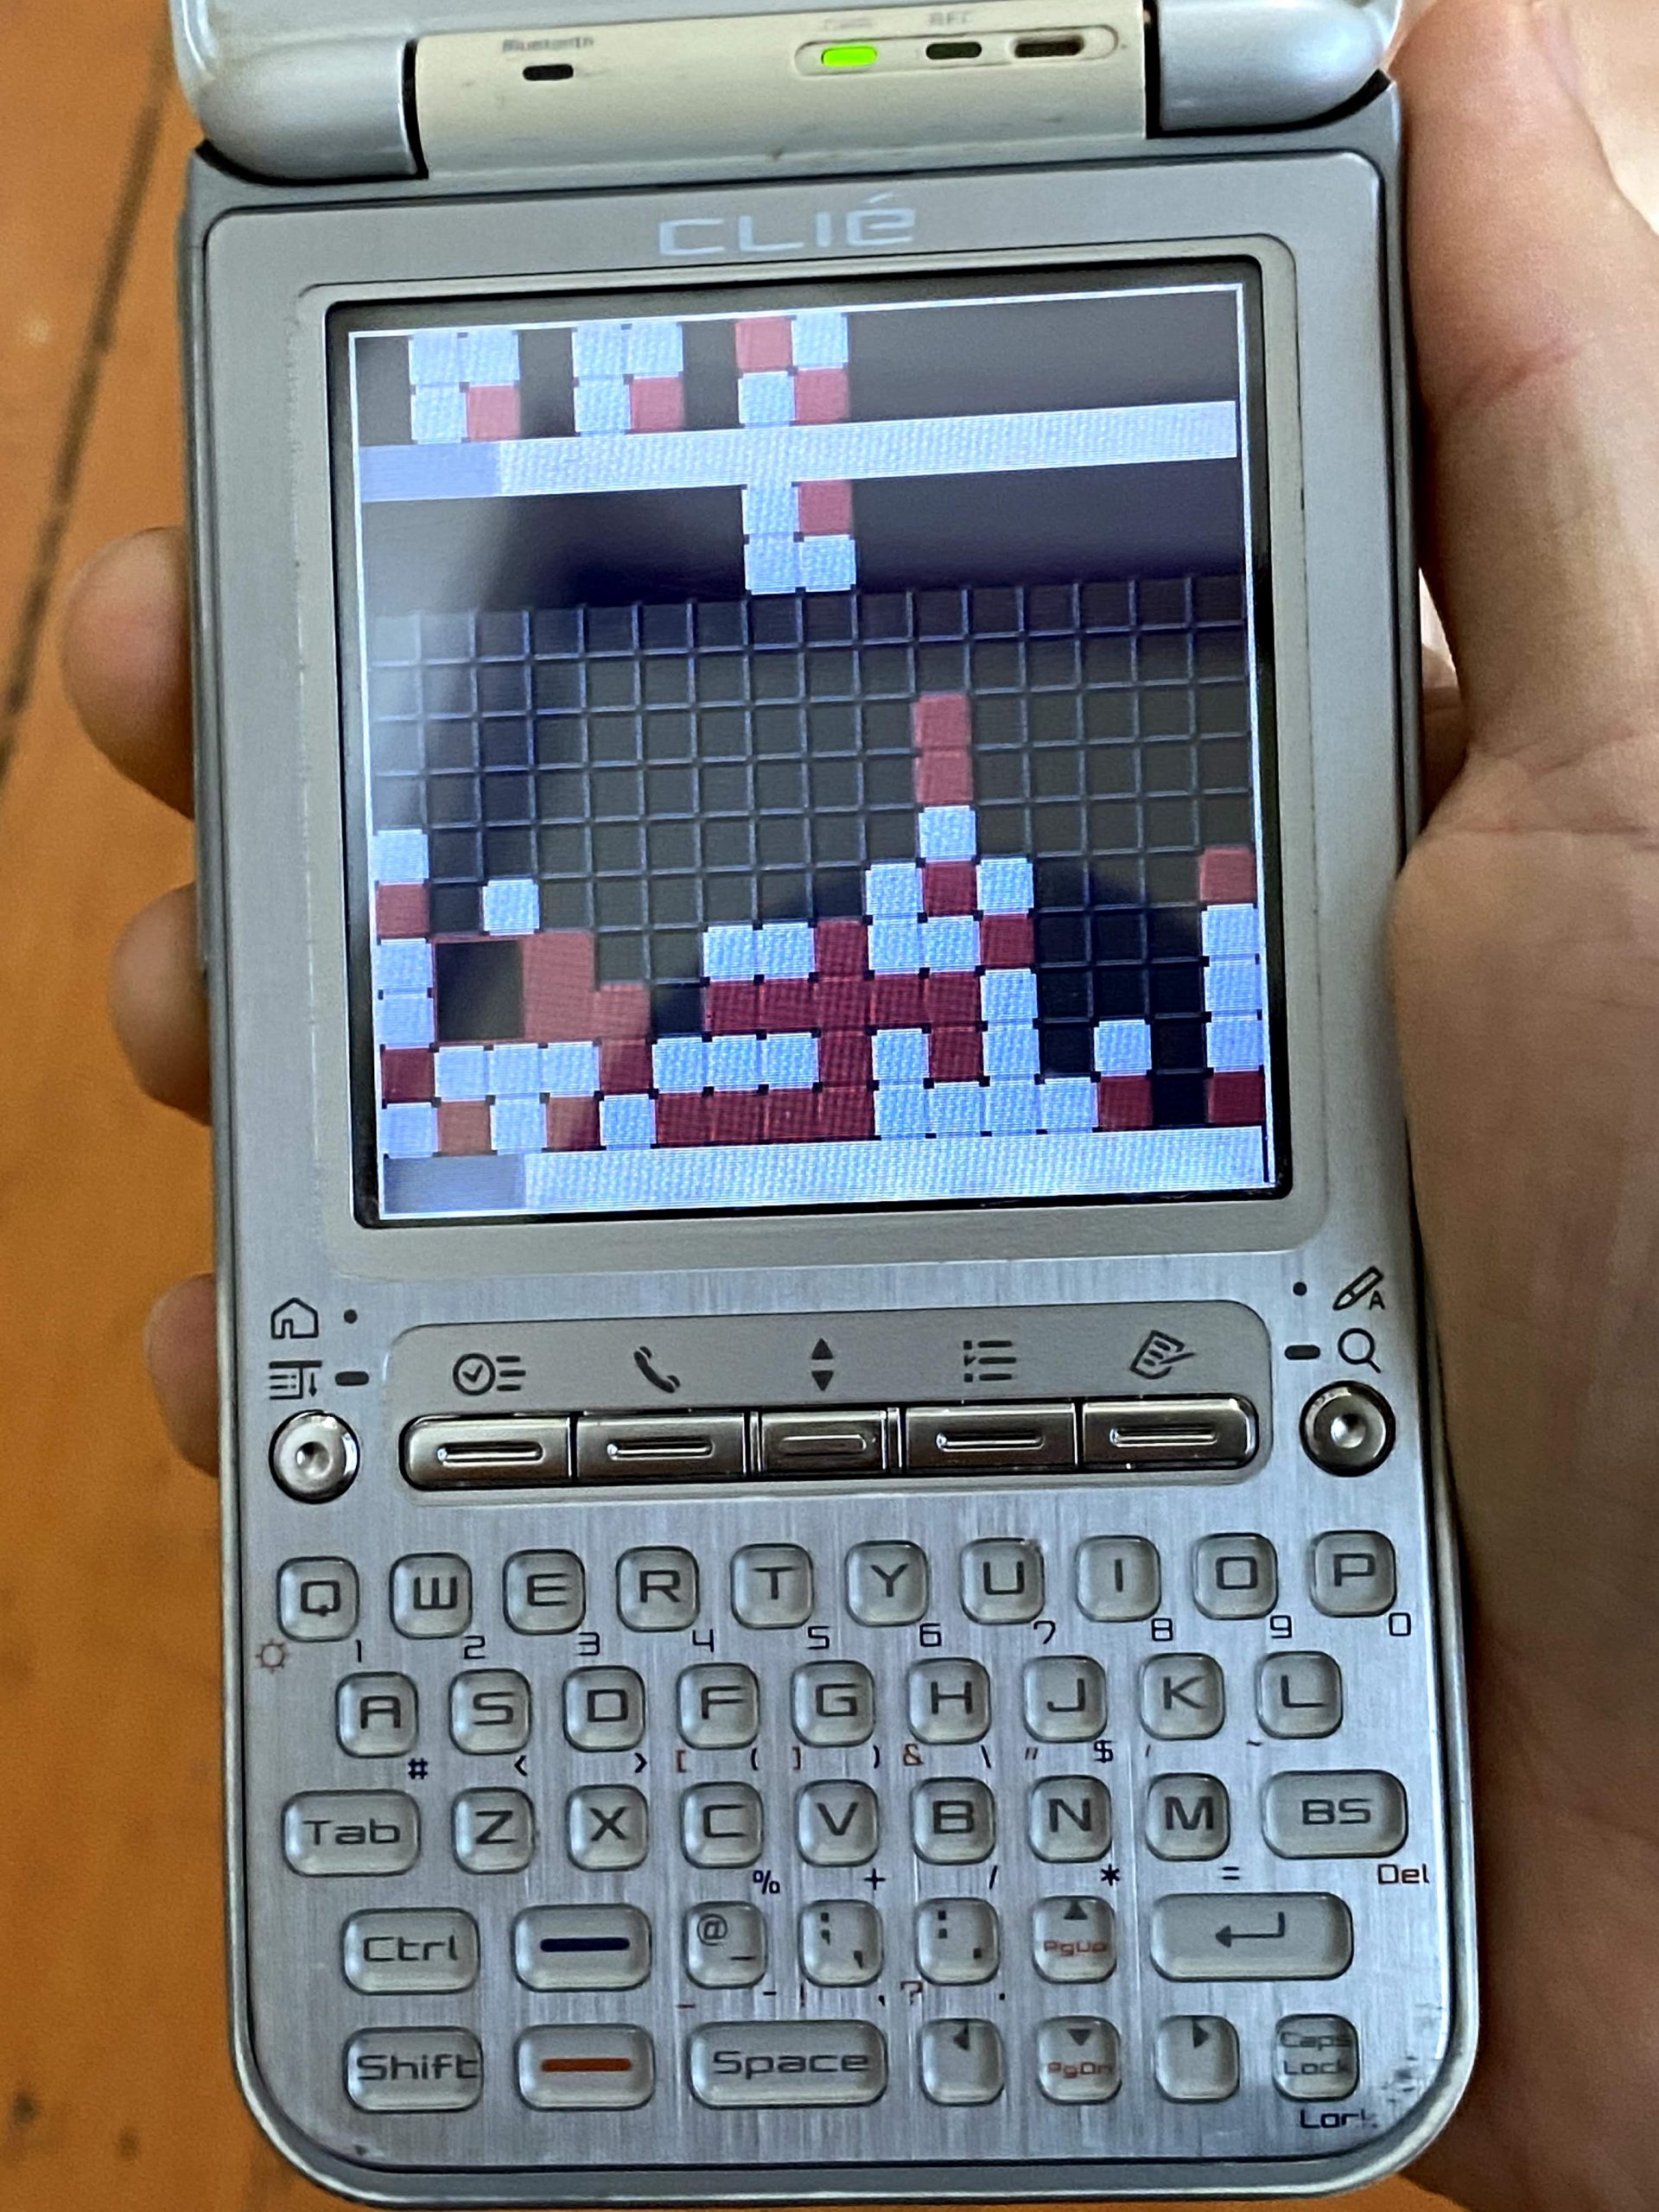
Another was a simple implementation of the PSP game Lumines. A friend had it on the PSP and I loved that game. Unfortunately, I didn’t have a PSP. But I did have an awesome PDA with a jog dial and a touch screen so I attempted to see if I could make a version of it on my CLIÉ. It’s been so long that I don’t remember what I wrote it in, but it was probably C++.